 |
An edited version of this paper was published by AGU.
Copyright 2005 American Geophysical Union.
GEOPHYSICAL RESEARCH LETTERS, VOL. 32, L19601, doi:10.1029/2005GL022957, 2005
NEW: an 2005 updated Version of figure 2,3 and 5 is available.
Jürgen Holfort and Edmond Hansen
Norwegian Polar Institute (NPI), Tromsø, Norway
Timeseries of temperature and salinity of Polar Water in the East Greenland Current (EGC) and on the East Greenland shelf at 79°N are presented. The observations in the EGC are made in the 45-74 dbar layer carrying liquid freshwater from the Arctic Ocean to subarctic seas. The properties on the outer fringe of the EGC are dominated by shifts of the position of the East Greenland Front (EGF). In the inner part of the EGC and on the shelf the seasonal cycle of the properties are dominated by the annual cycle of sea ice freezing and melting. Comparing the observations with the World Ocean Atlas (WOA) and other climatologies demonstrates that the climatologies in the EGC and on the shelf at 79°N are poor due to poor data coverage.
The western Fram Strait is a major gateway for export of freshwater from the Arctic Ocean to subarctic seas. This export is thought to be one of the main communication links between the Arctic and the Oceans thermohaline ``conveyor'', and is an important component of the global fresh water cycle (Aagard and Carmack(1989), Aagard and Carmack(1994)). The export occurs in liquid (Polar Water, PW) and solid (sea ice) phase. The flow of PW, generally defined as water with salinity less than 34.4 and temperature below 0°C, occurs both on the shelf and over the continental slope in the EGC.
Although western Fram Strait is acknowledged as a region of considerable oceanographic interest, hydrographic data from the area is sparse (Budeus and Schneider(1995)). Heavy ice prevents access to the area with most ships and is a challenge to oceanographic mooring work. Measuring temperature and salinity in the upper layers, where most of the freshwater is found, is particularly difficult due to icebergs and deep pressure ridges drifting through the region.
For an introduction to the hydrography and dynamics of the region, see recent works such as Schauer et al.(2004) and Fahrbach et al.(2001).
In this study we present year round timeseries of temperature and salinity from the PW layer in the western Fram Strait, sampled mostly during the EU funded VEINS and ASOF-N projects. The data should provide insight on the seasonal cycle of PW properties, and fill a gap in the hydrographic databases of the worlds oceans.
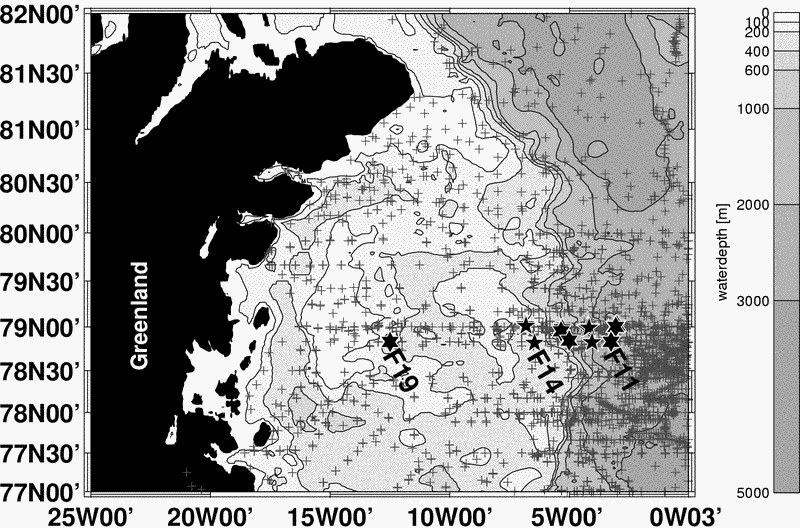
The data were sampled on moorings across the EGC on the East Greenland shelf slope and on the shelf itself at 79°N in Fram Strait. Since 1997 an array of four moorings, F11-F14, have recorded currents, temperature and salinity within the EGC at this latitude. F11 is located at 3°W on 2350 meters depth, F14 at 6°W on 300 meters depth (Fig.1). Here we present data from the uppermost instruments, measuring temperature and salinity of the PW at a nominal depth of 50m. As actual instrument depth varies slighlty from deployment to deployment, and the moorings may tilt due to current, the data used came from a 45-74 dbar pressure range.
The vertical stratification within this pressure range was calculated using the ``profiles'' resulting from the mooring tilt at F11 (the tilt at F12-F14 was to small to make sensible linear fits). The monthly mean stratification reaches values of about 0.02 PSU/m and 0.03°C/m in summer. The absolute values in winter are smaller reaching only 0.004 PSU/m and 0.02°C/m. The standard deviation of the monthly mean pressures lay between 4.1 dbar (F14) and 7.5 dbar (F12) with a range of ±10.5 dbar at F11 and ±5.7 dbar at F14. The expected error of the monthly means is therefore ±0.14/±0.03 (summer/winter) in salinity and ±0.22/±0.15°C in temperature at F11 and about half these values at F14.
In September 2003 two moorings were deployed on the East Greenland shelf, at 09°W (F18) and 12°30 W (F19) at about 200 meters depth. F18 was lost, however, most likely for reasons associated with both the mooring design and its location to close to the surface. F19 was a tube mooring designed and provided by IfM Hamburg, which have been successfully used on the East Greenland shelf at 74°N and 63°N (Holfort and Meincke(2005)). In this design two Microcats and the flotation are protected by a 40 m long polyethylene tube with diameter of about 20 cm. The tube is smooth and rather stiff, in order to prevent deep pressure ridges or icebergs to drag the mooring away. With one Microcat at the top and one at the bottom of the tube we were able to record shelf temperature and salinity timeseries from about 20 and 60 dbar. Mooring F19 survived the deployment in good shape, although the pressure time series indicates that it was hit by an iceberg forcing the upper instrument down from 23m to more then 80m in less then 30 minutes. After 9 hours the mooring was again free, but during that time it was dragged to a location two meter deeper.
For comparison with the timeseries we use climatologies and hydrographic data. Climatologies provide a synthesis of previous knowledge and are based on interpolation and extrapolation of historical data. The main climatology used here is the monthly ¼° by ¼° resolution World Ocean Atlas (WOA) [Conkright et al.(2002)]. In addition we are using yearly mean values of the 1° WOA, the Polar Science Center Hydrographic Climatology version 2.1 (PHC) [Steele et al.(2001)] atlas which also has a resolution of 1° and the WOCE Global Hydrographic Climatology (WGHC) [Gouretzki and Koltermann(2004)] with ½° resolution. The hydrographic data comes from publicly available datasets (mainly from ICES at http://www.ices.dk/ocean/ and WDC at http://www.ngdc.noaa.gov/wdc/usa/ocean.html ), which includes the data used for the WOA, and from recent cruises during the mooring period (mainly during mooring deployment).
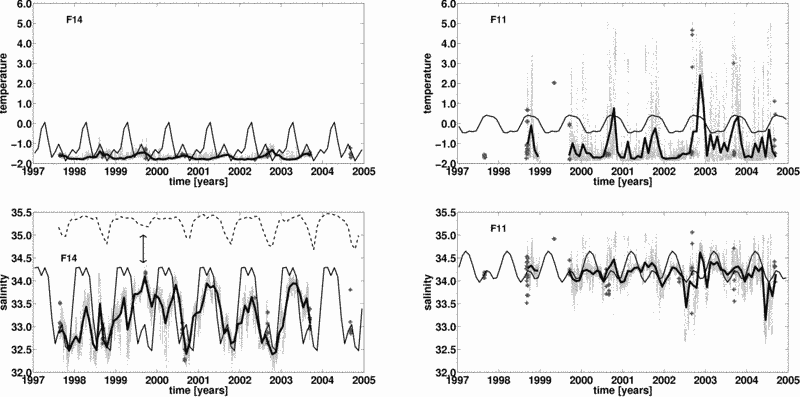
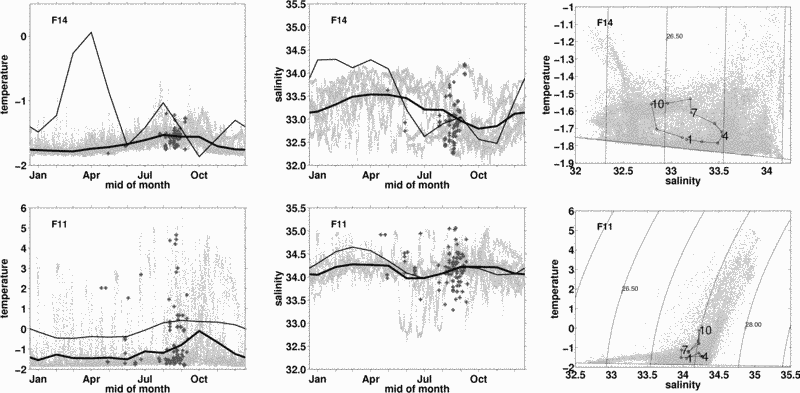
The temperature and salinity timeseries of F11 and F14 are shown in Fig.2. The average seasonal cycle at these moorings is shown in Fig.3 as timeseries and in TS space. The westernmost mooring, F14 on the shelf break, is well inside the PW and has lower mean temperature and salinity than the easternmost mooring, F11, situated near the EGF. The temperature and salinity of moorings F12 and F13, geographically located between F11 and F14, are more similar to F14 than to F11 and are not shown here.
At F14 the temperature is rather constant during the period, with little interannual variability. There is only a weak seasonal cycle which reaches its maximum at the end of summer (August/ September) (Fig.3). The salinity timeseries features both interannual variability (Fig.2) and a pronounced seasonal cycle ( Fig.3). The seasonal cycle displays a classical development; a salinity minimum in October after the summer sea ice melt; an increasing salinity during sea ice freeze reaching a maximum in April/May; before closing the loop with sinking salinity during the spring and summer melt toward the October minimum. The weakening winds during summer (e.g. NCEP Reanalysis data at http://www.cdc.noaa.gov/) reduce the transport of fresher water from the north, adding a secondary salinity maximum in August. On the interannual scale autumn 1999 stands out as a period of particularly high salinity. During this period there was an extensive ice cover in the northern Fram Strait (Fig.2), and we attribute the high salinity to less fresh water input due to melting ice.
F11 was more influenced by shifts of the position of the EGF, bringing water of Atlantic influence with temperatures up to 5°C and salinities up to 35 from the east to the mooring position. Although occurring throughout the year, they occur more often in autumn, causing a second salinity maximum (Fig.3). A possible mechanism is that the weaker winds in summer leads to a westward shift of the mean position of the EGF. Water of Atlantic influence is observed less frequently in the more western moorings, and do not penetrate onto the shelf break where they would show up on F14. There is also a seasonal cycle in the native PW of the EGC, with, similar to F14, maximum temperatures at the end of summer.
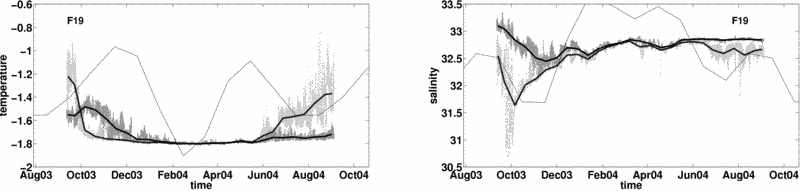
The instrumentation on nominally 20 and 60 dbars depth shows a behavior dominated by the influence of sea ice freeze up and melt, as already observed for F14. Considering the upper Microcat, we see (Fig.4) the temperature rising slowly during summer before reaching a maximum in September. It then drops to near freezing temperatures in winter. As surface cooling and ice formation destabilizes the water column promoting mixing to larger depths, the temperature drop during autumn occurs faster than the summer heating, where the stronger density stratification supresses mixing. Summer melting lowers the salinity, before the sea ice formation again increases the salinity towards winter. During winter the mooring demonstrates well mixed conditions from 20 dbar down to at least 60 dbar.
The lower Microcat on 60 dbar features the same cycle, only with smaller amplitudes and a positive phase shift (maximum and minimum occurring later in the year) demonstrating the work of vertical diffusion. However, late summer 2003 seems to be warmer and more saline than late summer 2004 in this layer. We attribute this to inflow of warmer and more saline water onto the shelf in 2003. This inflow is observed in summertime CTD sections, where the mean salinity of the water column is slightly higher in 2003 (≈33.4) than in 2004 (≈33.1).
In 2004 the surface freshening during summer does not reach the lower instrument, hence the salinity stays at the winter value (Fig.4). In the CTD data of summer 2004 there is a region of almost constant salinity between 40 dbar and 80 dbar extending to about 10°W, which explains, in part, the nearly constant salinity values of the 60 dbar time series: Vertical variability, e.g. due to internal waves or movement of the tube itself, does not lead to variability in salinity. This region is a remnant of winter convection, seen in the mooring data as periods of nearly neutral stratification. This is not observed in the 2003 CTD data, as intrusions of waters of Atlantic influence, although diluted, and following mixing destroyed this isostad and increased the temperature and salinities over the whole water column.
On the shelf slope F11 shows a difference between monthly observed and monthly climatology temperature of more than 1°C over the whole year (Fig.3), whereas salinity is comparable in summer but to high in the winter climatology (Fig.3). The F11 climatology salinities in winter is not within the standard deviation of the observed monthly means, but are at least within the range of the observations. On the shelf break at F14 the winter salinity climatology is even outside the range of the observations (Fig.3). The temperature climatology at F14 show to much variability and the winter values are much to high (Fig.3). The climatology here has its temperature maximum in winter while the observations have the maximum in late summer.
Only one year of data is available on the shelf, but since the climatological values are based on inter- and extrapolations of very sparse data a comparison with our observations is meaningful. The climatology winter salinities are again to high and the relatively fresh summer season starts to early and end to late (Fig. 4) with to low salinity values. Also in temperature the climatology winter season is much to short and therefore the summer season to long (Fig. 4). The climatology temperatures are generally to high.
Except for the late summer season hydrographic data is very sparse in this region, and nearly non-existent in winter. Therefore it is no surprise that the largest differences between our observations and climatology are found in winter. As there are probable more profiles done in the ice free ocean, the summer bias at F11 could arise because more profile came from the east of the EGF with warmer water of Atlantic influence as compared to the colder PW with higher ice cover on the western part of the front.
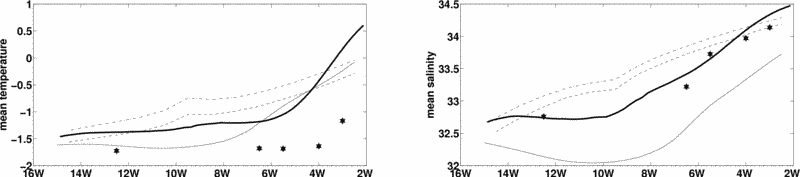
Combining all the measurements from each mooring into a long term mean value and comparing it to the climatologic mean value, the salinity values compare well for all sites (Fig.5) except for the WGHC. In temperature the mean climatologies are to warm, even when using surrounding grid points of the climatological fields. Only the WGHC temperature is quite realistic over the shelf till about 8°W.
Professor Jens Meincke at the Institut for Meereskunde, Universität Hamburg, provided the tube and instrumentation for mooring F19. During the VEINS project Alfred Wegener Institut für Polar und Meeresforschung (AWI) provided some of the instrumentation for mooring F11 to F14. On two occasions the mooring recovery and redeployment was performed with Polarstern. We acknowledge the support and help from our German collegues, without which these timeseries would have contained severe gaps. The authors would also like to thank a long line of predecessors at NPI and the crew of RV Lance for all their efforts to maintain these timeseries during the years. The mooring work has been supported by EU under the VEINS and ASOF-N projects.
|
 |
 |
 |
 |