Norwegian Polar Institute
2004

ASOF-N 2004
Jürgen Holfort and Edmond Hansen
Norwegian Polar Institute
2004
In 2003 the Norwegian Polar Institute (NPI) made one cruise into the Fram Strait as part of ASOF-N. During this cruise a total of 97 CTD stations were taken, three moorings were recovered and seven moorings were deployed. Further information on positions of CTD stations and moorings can be found in the cruise report (appendix 2).
This report describes into more detail the CTD data from this cruise and the data from the recovered moorings. It does not goes much into the scientific interpretation of the data but gives an overview of the applied data processing, the data quality and some statistical information. The data referenced in this report is still not in final form.
A total of 97 casts were taken with a Seabird 911 CTD. From two profiles large parts of the downcast were not recorded and therefore the upcast data had to be used (profile 47 and 70). A standard processing was done with the data, consisting of the following steps:
During the processing some problems were noticed and corrected
in the following profiles:
26: Pressure spikes to values larger then 1700 dbar (maximum
pressure of cast was about 1680 dbar) and smaller -0.6 dbar (the
pressure offset at the beginning of the cast was about -0.3 dbar
and at the end about -0.35 dbar). These spikes were recognized and
deleted in the normal processing.
47: Large spikes in pressure (<-1.6dbar and >250dbar, while
maximum pressure of cast was ~200dbar) and temperature (<2.6°C
and >7°C, while minimum temperature of cast is about 2.64°C).
But even after correcting this larger spikes, some wrong values in
down profile remain. The same holds for the conductivity. After
visual inspection of the salinity it was decided, that the down
profile is not usable. Therefore data from the upcast was used.
52: Many spikes in salinity due to strong gradients, these should
disappear in the further processing.
56: Many spikes in salinity due to strong gradients, these should
disappear in the further processing.
57: Uppermost 14.5 dbar not usable. They cannot be replaced by
upcast values, as the upcast data only goes to about 30m.
62: Uppermost 16 dbar not usable. They could be replaced by upcast
values, but as the upcast salinity does not show much structure the
missing upper dbar were taken as well mixed.
70: At least the upper 210m of salinity data is wrong. Also the
temperature seems to be not reliable in the upper 200m. The density
referenced to 0dbar is similar for the up and down profile at about
315 dbar. So at least the upper 250m of the down profile should be
replaced by the up profile. It was decided to forget the whole down
profile and just use the upcast.
The temperature and conductivity sensors of the CTD are routinely calibrated (Table 1). During data processing the pre-cruise calibration was used. The change between pre- and post-cruise calibration in temperature was smaller then 0.2*10-3 °C and therefore no further correction was applied. The drift of the conductivity sensor is so large (up to 0.009 mS/cm, see Figure 1) that it has to be taken into account. One reason for this large drift can be, that the sensor got a new conductivity cell in March 2003. The drift correction was done by fitting a polynom of 3rd order to the difference in pre- and post-cruise calibration. The CTD conductivity was then corrected using 6/8 of fitted difference. The factor 6/8 was used because the cruise took part about 6 months after the pre-cruise calibration and the time between calibrations was about 8 months. Salinity samples were taken on the cruise for latter processing on land. This processing was delayed and was done only some months later. Due to the longer storage the precision is probable not as high as if done directly after the cruise. A final calibration including the salinity samples is still not done.
| Parameter | Serialno. | date | g | h | i | j |
|---|---|---|---|---|---|---|
| Temperature | 4052 | 25.02.2003 | 4.37569960E-3 | 6.45432600E-4 | 2.23316560E-5 | 1.89617416E-6 |
| 20.11.2003 | 4.37602756E-3 | 6.46143228E-4 | 2.28383386E-5 | 2.01425091E-6 | ||
| Conductivity | 2063 | 21.03.2003 | -1.01165400E+1 | 1.40686609E+0 | -4.17922238E-3 | 3.80853515E-4 |
| 20.11.2003 | -1.01139822E+1 | 1.40611556E+0 | -3.86867383E-3 | 3.54596960E-4 |
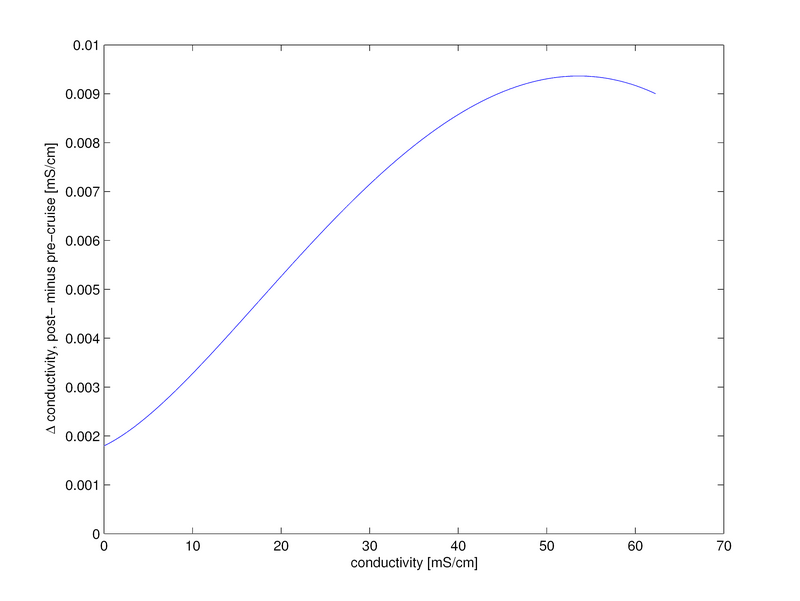
Figure 1: Conductivity difference between pre- and post cruise calibration of the CTD.
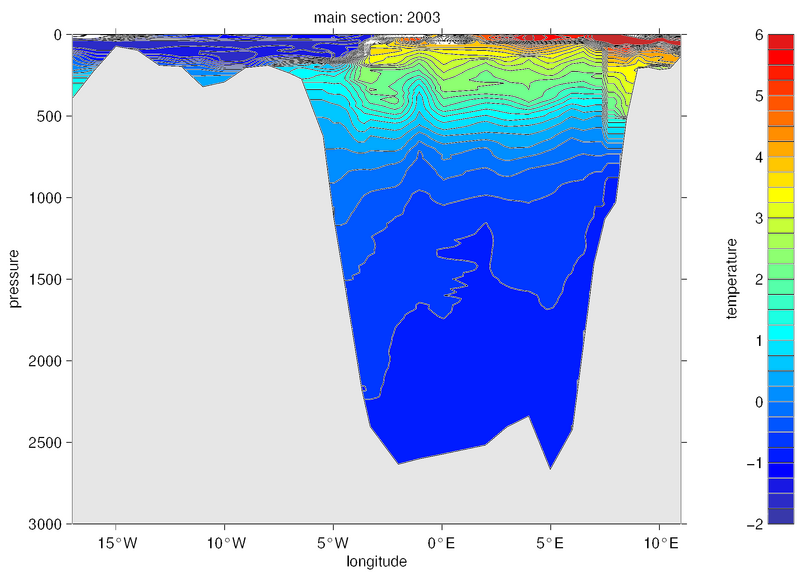
Sections of temperature and salinity across Fram Strait at 79°N (Figure 2) show the different water masses present. As very little ice was encountered on this cruise, the CTD section could be made all the way to the East Greenland coast. So it is one of the few sections that shows the total area of the cold and low salinity Polar Water. The inflowing Atlantic water is warm and salty and is found in the upper 600m in the eastern part. The still warm and saline water at about 3°W is the recirculating part (rAW) and the region of higher salinities at the Greenland continental slope seen till depths of about 1200m is Arctic Atlantic Water. The baroclinic part of the East Greenland current can be clearly seen in geostrophic calculations (Figure 3) relative to the bottom.
 |
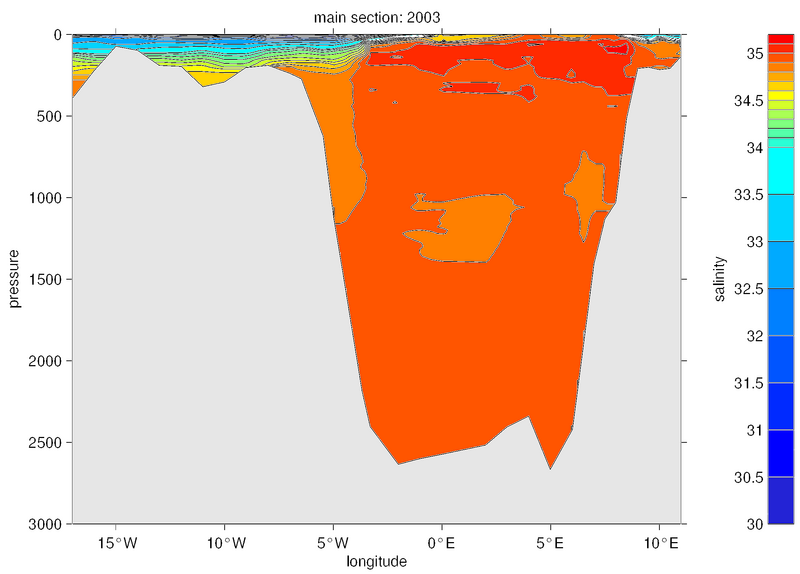 |
| Figure 2: Section of temperature (left) and salinity (right) at 79°N from the uncalibrated 2003 CTD data. |
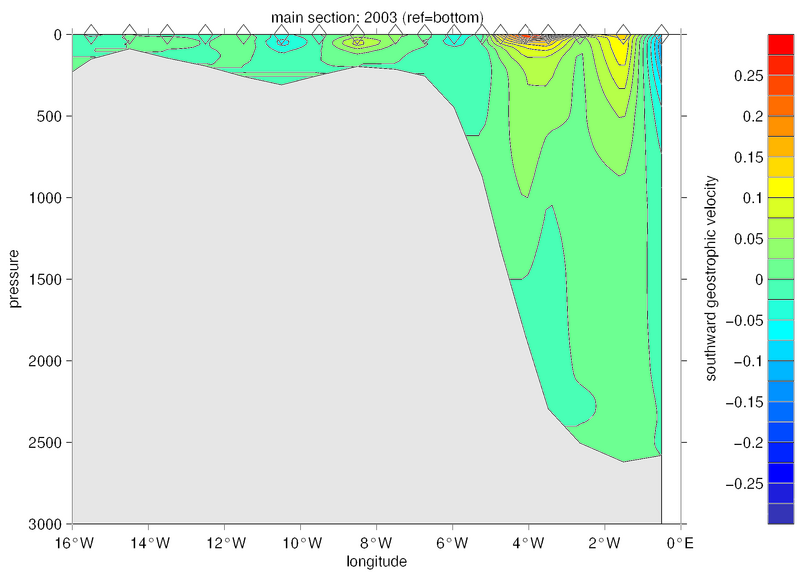
Figure 3: Section of geostrophic
velocity along 79°N in the
western Fram Strait showing the East Greenland current.
From the five moorings deployed in 2002 only three could be fully recovered. Mooring F13 was a total loss. Two instruments from mooring F12 were picked out of the sea/ice in April 2003 by a fishing boat. Data from this instruments shows that the mooring surfaced due to unknown reasons at the beginning of April. Instrument loses therefore were large (in parenthesis percent of deployed instruments): two ULS (50%), two DCM (67%), five RCM (33%), two Microcat (50%) and two releasers (40%).
A common problem also occurring in these data is the presence of a large offset and drift in salinity of many RCM. This is mostly corrected using the difference to nearby CTD stations at the beginning and the end of the mooring deployment. This method has large errors if the temporal and spatial variability of the salinity is large near the instrument position. Near to the surface, where the largest errors occur, at two moorings there was an Microcat in less then 3m distance from the RCM. The nominal accuracy of a Microcat is much better then an RCM and therefore at these two moorings the salinity from the Microcat is used to calibrate the RCM conductivity using an offset and a linear temporal drift.
A comparison of the corrected RCM salinity and the Microcat salinity reveals a possible problem with the later. Small dirt particles entering the conductivity cell lead to erroneous measurements. As the conductivity cell is very small and not flushed with a pump like on a Seabird 911 CTD, dirt can accumulate and stay for prolonged time periods in the cell. With the RCM this problems is not as big, as the cell is much larger and more easily flushed.
These salinity problems can both be seen in the instrument pair RCM 843 and SBE 2413 on mooring F11. The uncorrected RCM salinities were much to high. A comparison with the Microcat 2413 above showed a conductivity offset of about 0.5 mS/cm and a small temporal trend. After this correction the RCM and Microcat salinity is very similar for most times, but during some periods SBE 2413 shows much smaller salinities (Figure 4). We can exclude a strong gradient exactly in between both instruments, because during a time of lower salinities the instruments itself made vertical excursions of more then 50dbar. We therefore assume some dirt in the Microcat sensor. No such problems are noticeable in the instrument pair RCM 836 SBE 1253 after correction of the conductivity offset (0.85) and drift.
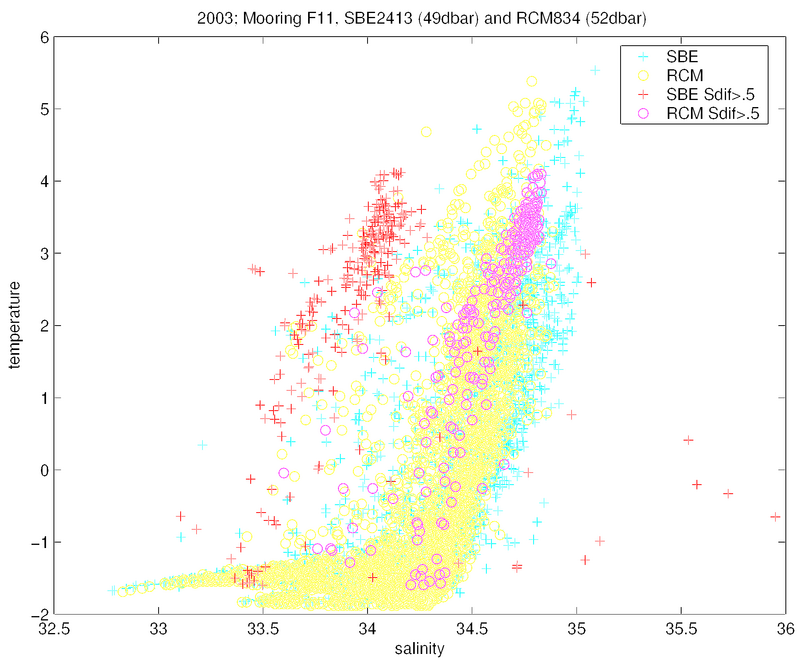
Figure 4: Temperature salinity diagram of two instruments at almost
the same depth on Mooring F11 (Microcat 2413 and drift and offset
corrected RCM 834). For times where the difference between both is
larger then 0.5 the Microcat values lie outside the main TS
characteristics while the RCM values lie within.
Both recovered ULS had problems with the pressure sensor. This can clearly seen by comparing with other instruments nearby. For the ULS 17 this is the Microcat 1253; for the ULS 48 it is the DCM 17 and the Microcat 2414. The ULS record total pressure while the Microcat and DCM measure pressure relative to the mean atmospheric pressure. This is corrected by adding a standard atmospheric pressure of 1013.5mbar onto the Microcat and DCM data. The Microcat is not at the same depth, but as the depth difference is small the pressure should behave similar to the ULS. While the temporal evolution of the DCM and Microcat pressure, apart from an offset due to vertical instrument separation, is almost identical, the pressure from the ULS differs. The pressure difference between ULS and the two other instruments is a non linear function in time (Figure 5). No simple correlation of the pressure difference with temperature or pressure could be found.
The ULS 17 can only be compared with a Microcat. The minimum pressure (reached when the mooring is standing upright) is more constant in the SBE data then in the ULS data. Therefore the SBE data, as with the other mooring, is probably most trustworthy then the ULS data. Clearly more work is necessary to get better ULS pressure data, specially as these data is an important part in the ice thickness calculation.
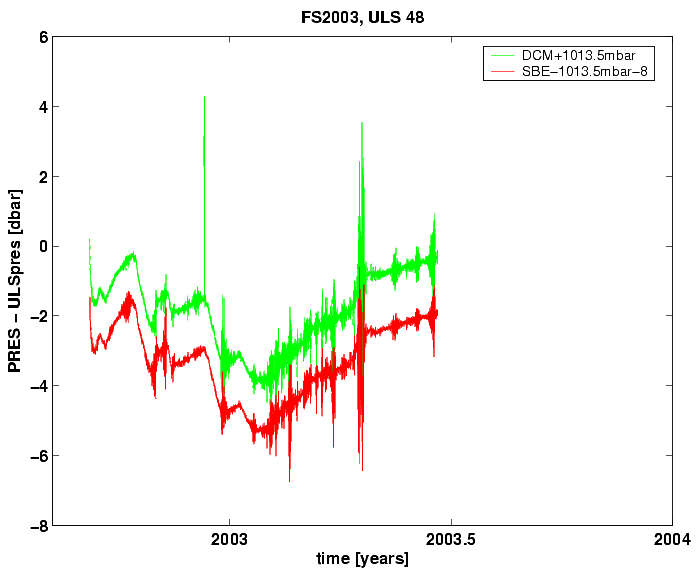
Figure 5: Pressure difference between ULS 48 and the DCM 17 in the
same instrument package and the Microcat 2413 some meters below.
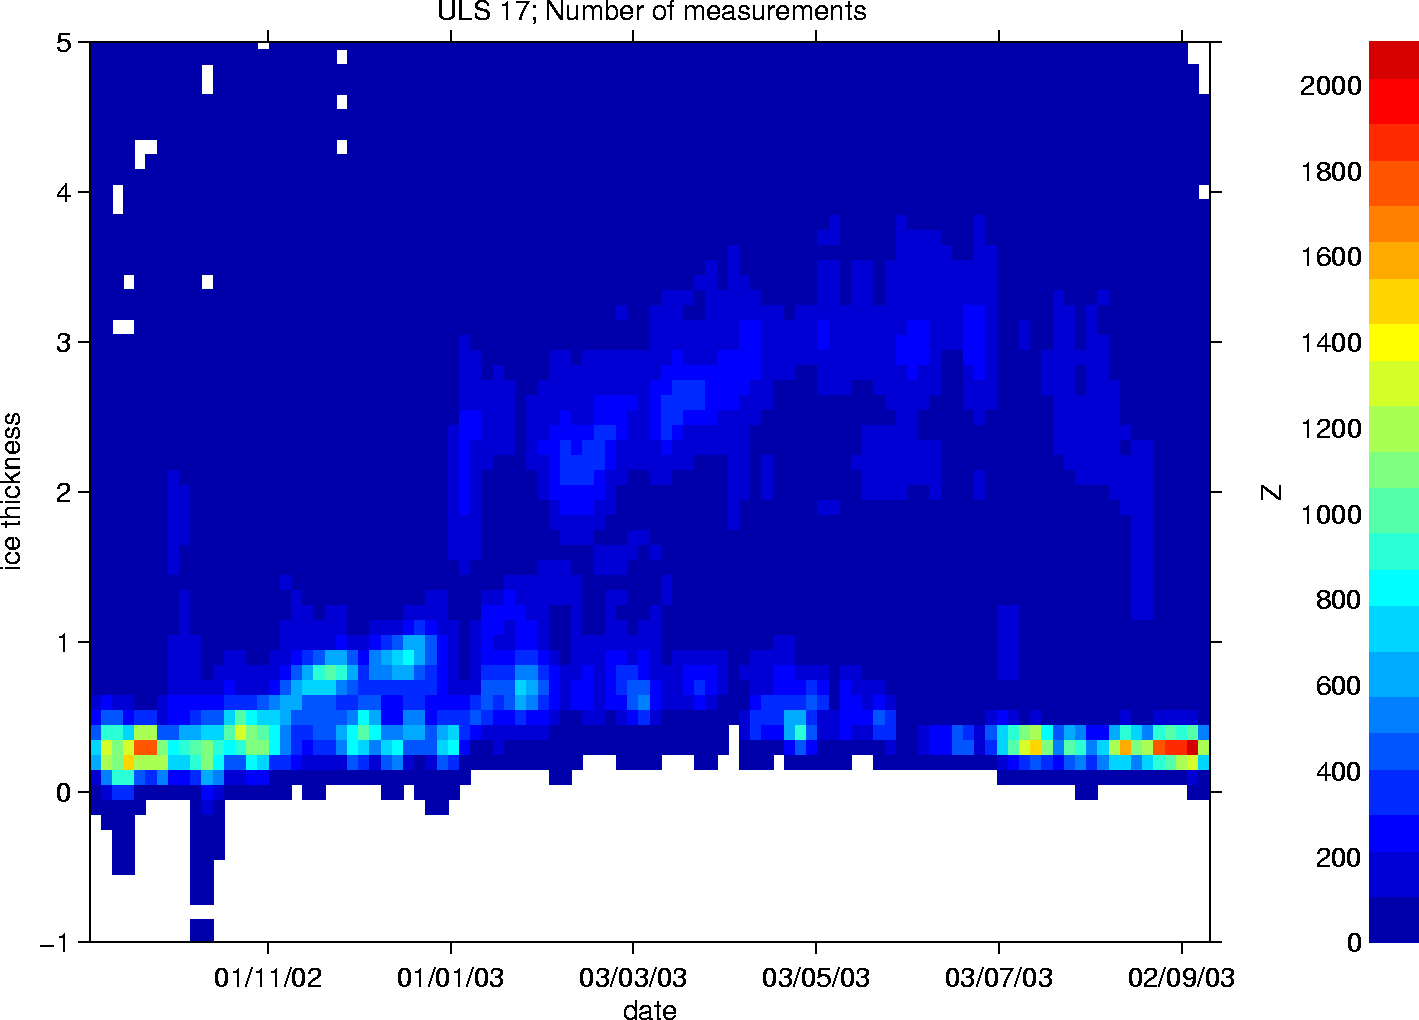
Figure 6:
Frequency of ice thickness (number of measurements within a certain
thickness and time class) from a preliminary calculation from ULS
17.
A new method for the calculation of ice thickness is being developed at the NPI. High quality data of ice thickness from the ULS data will therefore not be available before 2005. But the ULS data is available once the new method is established and has also the potential as can be seen in a preliminary, rough estimate of the ice thickness (Figure6). This rough calculations used just one of the four available travel time measurements, did not take into account the signal envelope and used just the mean sea level pressure from the NCEP reanalysis with 2.5° spatial and 6 hour temporal resolution. But even so the increase of ice thickness during winter, mostly open water in Summer 2003, and other features are visible.
A simple tidal analysis was performed on the velocity data from the moorings. For most of the instruments the largest amplitudes was found in the M2 tide. Further results are given, together with the basic statistic information (mean values, eddy kinetic energy etc.) in appendix 1.
FILE: fs2003/dcm17_0.nc Start date: 06-Sep-2002 13:58:08 Stop date: 07-Sep-2003 06:00:00 No. of cycles: 4389 Sampling intervall: 120 minutes Pressure: Median= 0, Mean= 1+- 4.5, Range= 0 to 49 missing values: 31 U-Velocity: Median= -3.55, Mean= -3.14+- 24.41, Range=-106.6 to 165.2 MKE: 9.8 EKE: 595.7 V-Velocity: Median=-18.78, Mean=-18.47+- 29.78, Range=-140.5 to 113.2 MKE: 341.3 EKE: 886.7 Tides (snr>2): No. tide Period major emaj minor emin inc pha 5 P1 24.07 1.67 1.09 -0.27 1.18 58.2 193.3 2 K1 23.93 2.25 1.34 -0.32 1.22 109.9 248.2 1 M2 12.42 3.42 1.44 -0.79 1.61 84.9 59.7 4 LDA2 12.22 1.93 1.33 -0.66 1.60 69.2 39.7 3 S2 12.00 1.94 1.26 -0.64 1.48 122.2 88.4 after 30h low pass filter: U-Velocity: Median= -3.42, Mean= -2.56+- 21.16, Range= -88.9 to 113.7 MKE: 6.6 EKE: 447.6 V-Velocity: Median=-19.11, Mean=-18.16+- 25.69, Range=-104.6 to 96.7 MKE: 329.8 EKE: 659.8 FILE: fs2003/dcm17_1.nc Start date: 06-Sep-2002 13:58:08 Stop date: 07-Sep-2003 06:00:00 No. of cycles: 4389 Sampling intervall: 120 minutes Pressure: Median= 6, Mean= 7+- 4.8, Range= 6 to 57 missing values: 31 U-Velocity: Median= -0.88, Mean= -1.15+- 12.93, Range= -59.7 to 117.7 MKE: 1.3 EKE: 167.1 V-Velocity: Median=-10.06, Mean=-11.42+- 12.78, Range= -79.9 to 64.7 MKE: 130.5 EKE: 163.3 Tides (snr>2): No. tide Period major emaj minor emin inc pha 1 M2 12.42 1.80 0.89 -0.45 0.96 80.4 57.5 after 30h low pass filter: U-Velocity: Median= -1.14, Mean= -0.92+- 10.29, Range= -37.9 to 69.4 MKE: 0.8 EKE: 105.9 V-Velocity: Median=-10.85, Mean=-11.32+- 9.22, Range= -47.0 to 35.6 MKE: 128.1 EKE: 85.0 FILE: fs2003/dcm17_2.nc Start date: 06-Sep-2002 13:58:08 Stop date: 07-Sep-2003 06:00:00 No. of cycles: 4389 Sampling intervall: 120 minutes Pressure: Median= 12, Mean= 14+- 5.1, Range= 12 to 65 missing values: 31 U-Velocity: Median= -2.79, Mean= -3.16+- 13.52, Range= -92.4 to 106.5 MKE: 10.0 EKE: 182.7 V-Velocity: Median=-12.28, Mean=-13.49+- 15.04, Range= -68.1 to 48.7 MKE: 181.9 EKE: 226.1 Tides (snr>2): No. tide Period major emaj minor emin inc pha 1 SA 8766.23 7.64 3.40 -1.86 3.15 90.5 65.6 3 SSA 4382.91 4.16 2.86 2.88 2.69 124.6 179.4 2 MSM 763.49 4.96 2.62 0.46 3.26 134.7 179.5 4 MM 661.31 3.94 2.70 -0.03 3.23 21.8 259.9 8 P1 24.07 0.98 0.61 0.10 0.63 75.1 197.9 6 S1 24.00 1.66 0.98 0.32 0.84 35.6 206.1 7 K1 23.93 1.41 0.54 -0.02 0.57 108.6 241.5 5 M2 12.42 2.76 1.04 -0.89 0.94 74.6 62.6 after 30h low pass filter: U-Velocity: Median= -2.99, Mean= -3.05+- 10.64, Range= -40.5 to 37.9 MKE: 9.3 EKE: 113.1 V-Velocity: Median=-12.01, Mean=-13.51+- 12.47, Range= -55.6 to 22.5 MKE: 182.4 EKE: 155.6 FILE: fs2003/dcm17_3.nc Start date: 06-Sep-2002 13:58:08 Stop date: 07-Sep-2003 06:00:00 No. of cycles: 4389 Sampling intervall: 120 minutes Pressure: Median= 18, Mean= 20+- 5.5, Range= 18 to 72 missing values: 31 U-Velocity: Median= -3.66, Mean= -4.16+- 11.31, Range= -48.7 to 45.5 MKE: 17.3 EKE: 127.9 V-Velocity: Median=-12.14, Mean=-13.74+- 14.28, Range= -72.2 to 31.3 MKE: 188.8 EKE: 203.9 Tides (snr>2): No. tide Period major emaj minor emin inc pha 1 SA 8766.23 6.85 3.77 -0.81 2.60 101.2 59.3 2 SSA 4382.91 4.94 3.10 1.35 2.74 91.8 175.0 3 MSM 763.49 4.88 3.05 0.14 2.88 120.9 176.0 4 MM 661.31 4.20 2.70 -1.05 2.83 27.4 243.0 6 K1 23.93 1.36 0.55 0.05 0.53 92.7 230.1 5 M2 12.42 3.07 0.72 -1.28 0.67 73.6 61.2 8 LDA2 12.22 1.04 0.61 -0.47 0.61 61.6 31.4 7 S2 12.00 1.22 0.60 -0.78 0.66 107.6 108.3 9 K2 11.97 0.82 0.53 -0.56 0.53 79.5 161.5 after 30h low pass filter: U-Velocity: Median= -3.83, Mean= -4.08+- 9.42, Range= -39.8 to 29.3 MKE: 16.6 EKE: 88.7 V-Velocity: Median=-11.95, Mean=-13.80+- 12.62, Range= -59.6 to 23.2 MKE: 190.5 EKE: 159.3 FILE: fs2003/dcm17_4.nc Start date: 06-Sep-2002 13:58:08 Stop date: 07-Sep-2003 06:00:00 No. of cycles: 4389 Sampling intervall: 120 minutes Pressure: Median= 25, Mean= 27+- 5.9, Range= 23 to 80 missing values: 31 U-Velocity: Median= -3.56, Mean= -3.98+- 10.70, Range= -49.8 to 38.1 MKE: 15.9 EKE: 114.6 V-Velocity: Median=-11.48, Mean=-12.99+- 14.26, Range= -70.9 to 36.7 MKE: 168.7 EKE: 203.2 Tides (snr>2): No. tide Period major emaj minor emin inc pha 1 SA 8766.23 6.03 3.47 -0.17 2.53 106.7 56.6 2 SSA 4382.91 5.24 3.34 0.89 2.57 84.4 179.0 3 MSM 763.49 5.02 3.36 0.19 2.89 116.1 174.9 4 MM 661.31 4.04 2.53 -1.63 2.57 30.8 233.6 8 O1 25.82 0.60 0.36 -0.03 0.43 115.6 180.6 7 K1 23.93 1.46 0.39 0.07 0.43 103.6 237.4 5 M2 12.42 3.39 0.78 -1.15 0.71 79.0 59.2 6 S2 12.00 1.50 0.63 -0.74 0.65 98.0 132.0 after 30h low pass filter: U-Velocity: Median= -3.89, Mean= -3.92+- 9.07, Range= -36.7 to 29.3 MKE: 15.3 EKE: 82.2 V-Velocity: Median=-11.11, Mean=-13.10+- 12.95, Range= -59.5 to 23.6 MKE: 171.5 EKE: 167.8 FILE: fs2003/dcm17_5.nc Start date: 06-Sep-2002 13:58:08 Stop date: 07-Sep-2003 06:00:00 No. of cycles: 4389 Sampling intervall: 120 minutes Pressure: Median= 31, Mean= 33+- 6.3, Range= 29 to 88 missing values: 31 U-Velocity: Median= -3.30, Mean= -3.74+- 9.77, Range= -49.3 to 34.3 MKE: 14.0 EKE: 95.4 V-Velocity: Median=-10.42, Mean=-11.99+- 13.32, Range= -68.8 to 29.6 MKE: 143.8 EKE: 177.3 Tides (snr>2): No. tide Period major emaj minor emin inc pha 1 SA 8766.23 5.26 2.89 0.30 2.35 109.4 53.1 2 SSA 4382.91 4.89 3.33 0.77 2.62 79.3 178.0 3 MSM 763.49 4.52 3.16 0.37 2.39 111.6 171.4 4 MM 661.31 3.94 2.62 -1.33 2.56 28.3 231.0 9 O1 25.82 0.69 0.33 0.08 0.31 115.4 193.5 7 K1 23.93 1.50 0.37 0.10 0.32 101.8 242.4 5 M2 12.42 3.44 0.66 -1.31 0.61 79.3 61.1 8 LDA2 12.22 0.83 0.57 -0.57 0.49 22.1 62.7 6 S2 12.00 1.52 0.67 -0.69 0.57 101.8 131.7 10 K2 11.97 0.67 0.44 -0.36 0.53 121.5 138.2 11 2MK6 4.09 0.20 0.14 -0.02 0.15 24.9 114.6 after 30h low pass filter: U-Velocity: Median= -3.50, Mean= -3.70+- 8.41, Range= -33.9 to 26.4 MKE: 13.7 EKE: 70.7 V-Velocity: Median=-10.13, Mean=-12.12+- 12.20, Range= -56.1 to 21.2 MKE: 146.8 EKE: 148.7 FILE: fs2003/rcm10069.nc Start date: 06-Sep-2002 14:00:56 Stop date: 07-Sep-2003 05:57:11 No. of cycles: 4389 Sampling intervall: 120 minutes Temperature: Median=-0.794, Mean=-0.803+- 0.033, Range=-0.901 to -0.708 Salinity: Median=35.336, Mean=35.334+- 0.016, Range=35.270 to 35.375 Velocity: Median= 6.22, Mean= 7.07+- 4.57, Range= 0.0 to 28.0 U-Velocity: Median= -0.47, Mean= -0.27+- 3.94, Range= -18.0 to 15.6 MKE: 0.1 EKE: 15.5 V-Velocity: Median= -1.20, Mean= -1.23+- 7.33, Range= -27.5 to 23.8 MKE: 1.5 EKE: 53.8 Tides (snr>2): No. tide Period major emaj minor emin inc pha 3 O1 25.82 0.72 0.16 0.09 0.18 103.7 205.5 5 P1 24.07 0.47 0.17 -0.06 0.18 114.6 257.2 2 K1 23.93 1.38 0.17 0.33 0.18 103.0 266.6 6 N2 12.66 0.32 0.10 0.08 0.14 88.6 75.9 9 H1 12.44 0.13 0.09 -0.06 0.11 63.0 330.1 1 M2 12.42 1.63 0.11 0.28 0.13 86.1 97.8 4 S2 12.00 0.51 0.12 0.16 0.13 76.2 135.0 7 R2 11.98 0.18 0.09 -0.07 0.08 99.9 338.2 8 K2 11.97 0.13 0.09 0.08 0.09 27.7 113.0 10 MS4 6.10 0.07 0.04 -0.03 0.04 85.0 276.8 after 30h low pass filter: U-Velocity: Median= -0.36, Mean= -0.27+- 3.68, Range= -16.6 to 15.6 MKE: 0.1 EKE: 13.5 V-Velocity: Median= -1.25, Mean= -1.23+- 7.03, Range= -25.4 to 20.8 MKE: 1.5 EKE: 49.4 FILE: fs2003/rcm11059.nc Start date: 03-Sep-2002 13:58:08 Stop date: 08-Sep-2003 09:59:04 No. of cycles: 4439 Sampling intervall: 120 minutes Temperature: Median=-1.561, Mean=-1.418+- 0.693, Range=-1.924 to 3.395 Velocity: Median= 7.20, Mean= 7.80+- 4.27, Range= 1.1 to 28.7 U-Velocity: Median= -1.92, Mean= -1.76+- 5.46, Range= -17.8 to 20.2 MKE: 3.1 EKE: 29.9 V-Velocity: Median= -1.17, Mean= -1.05+- 6.71, Range= -28.6 to 22.2 MKE: 1.1 EKE: 45.0 Tides (snr>2): No. tide Period major emaj minor emin inc pha 6 O1 25.82 0.59 0.15 0.25 0.15 158.1 242.8 9 P1 24.07 0.42 0.15 0.11 0.16 161.4 297.7 4 K1 23.93 1.17 0.15 0.52 0.14 160.4 301.8 8 2N2 12.91 0.47 0.31 -0.29 0.29 95.3 336.7 3 N2 12.66 1.27 0.31 -0.84 0.34 65.1 40.0 1 M2 12.42 5.61 0.29 -3.25 0.28 66.2 73.8 7 LDA2 12.22 0.50 0.24 -0.47 0.27 21.4 96.4 2 S2 12.00 2.16 0.33 -1.25 0.29 73.0 124.2 13 R2 11.98 0.31 0.21 -0.25 0.21 76.7 211.0 5 K2 11.97 0.62 0.25 -0.28 0.27 55.5 132.4 10 MSN2 11.79 0.38 0.24 -0.31 0.26 91.6 257.3 11 ETA2 11.75 0.35 0.21 -0.28 0.21 117.8 234.8 15 MN4 6.27 0.18 0.09 -0.13 0.10 100.5 139.9 12 M4 6.21 0.32 0.10 -0.16 0.10 129.4 153.2 14 MS4 6.10 0.26 0.11 -0.11 0.09 121.7 211.7 after 30h low pass filter: U-Velocity: Median= -2.09, Mean= -1.76+- 3.88, Range= -15.6 to 10.6 MKE: 3.1 EKE: 15.1 V-Velocity: Median= -0.85, Mean= -1.05+- 4.64, Range= -20.2 to 13.3 MKE: 1.1 EKE: 21.5 FILE: fs2003/rcm117.nc Start date: 03-Sep-2002 14:00:56 Stop date: 08-Sep-2003 10:04:41 No. of cycles: 4439 Sampling intervall: 120 minutes Pressure: Median= 634, Mean= 634+- 0.0, Range= 634 to 634 Temperature: Median= 0.260, Mean= 0.266+- 0.094, Range= 0.024 to 0.589 Salinity: Median=36.259, Mean=36.282+- 0.121, Range=36.067 to 36.648 Velocity: Median= 4.00, Mean= 4.54+- 2.73, Range= 0.0 to 18.9 U-Velocity: Median= 1.61, Mean= 1.49+- 2.85, Range= -12.5 to 12.3 MKE: 2.2 EKE: 8.1 V-Velocity: Median= -1.43, Mean= -1.30+- 4.01, Range= -14.0 to 18.0 MKE: 1.7 EKE: 16.0 Tides (snr>2): No. tide Period major emaj minor emin inc pha 2 SSA 4382.91 1.42 0.94 0.07 0.64 115.1 79.9 5 O1 25.82 0.62 0.13 0.33 0.13 138.3 233.3 7 P1 24.07 0.41 0.17 0.15 0.14 158.7 288.5 3 K1 23.93 1.29 0.13 0.57 0.15 139.0 294.8 6 N2 12.66 0.55 0.21 -0.14 0.20 69.1 72.7 1 M2 12.42 1.84 0.24 0.26 0.22 84.5 108.9 4 S2 12.00 0.98 0.23 -0.17 0.21 162.1 223.5 9 R2 11.98 0.28 0.15 -0.22 0.15 16.3 63.0 8 K2 11.97 0.40 0.18 -0.21 0.17 175.0 245.5 after 30h low pass filter: U-Velocity: Median= 1.59, Mean= 1.49+- 1.95, Range= -6.2 to 8.0 MKE: 2.2 EKE: 3.8 V-Velocity: Median= -1.47, Mean= -1.30+- 3.34, Range= -11.6 to 14.5 MKE: 1.7 EKE: 11.2 FILE: fs2003/rcm11889.nc Start date: 03-Sep-2002 12:00:00 Stop date: 08-Sep-2003 11:51:34 No. of cycles: 4441 Sampling intervall: 120 minutes Pressure: Median= 278, Mean= 278+- 0.4, Range= 277 to 280 Temperature: Median= 0.776, Mean= 0.778+- 0.167, Range= 0.179 to 1.099 Velocity: Median= 5.44, Mean= 5.84+- 2.94, Range= 0.4 to 17.8 U-Velocity: Median= 0.48, Mean= 0.50+- 3.76, Range= -11.2 to 14.6 MKE: 0.3 EKE: 14.1 V-Velocity: Median= -1.15, Mean= -1.00+- 5.24, Range= -16.8 to 15.9 MKE: 1.0 EKE: 27.4 Tides (snr>2): No. tide Period major emaj minor emin inc pha 5 O1 25.82 0.70 0.17 -0.31 0.15 178.1 287.3 12 NO1 24.83 0.18 0.12 -0.02 0.11 3.6 98.4 8 P1 24.07 0.44 0.18 -0.21 0.18 171.7 319.9 2 K1 23.93 1.61 0.14 -0.59 0.15 168.6 336.9 9 2N2 12.91 0.40 0.26 -0.19 0.28 80.7 45.7 4 N2 12.66 0.96 0.24 -0.56 0.30 85.6 54.5 11 NU2 12.63 0.36 0.22 -0.23 0.26 106.5 31.1 7 H1 12.44 0.57 0.23 -0.48 0.23 44.7 171.3 1 M2 12.42 4.28 0.29 -2.39 0.31 71.4 89.2 10 H2 12.40 0.39 0.25 -0.03 0.28 70.2 136.9 3 S2 12.00 1.54 0.29 -0.84 0.31 46.3 114.6 6 K2 11.97 0.68 0.22 -0.36 0.24 47.6 121.9 13 MK4 6.09 0.11 0.08 -0.07 0.08 168.4 94.4 after 30h low pass filter: U-Velocity: Median= 0.46, Mean= 0.50+- 1.73, Range= -7.2 to 8.3 MKE: 0.3 EKE: 3.0 V-Velocity: Median= -0.85, Mean= -1.00+- 3.55, Range= -12.6 to 11.9 MKE: 1.0 EKE: 12.6 FILE: fs2003/rcm12643.nc Start date: 06-Sep-2002 09:59:04 Stop date: 08-May-2003 17:57:11 No. of cycles: 2933 Sampling intervall: 120 minutes Temperature: Median= 1.209, Mean= 1.027+- 1.072, Range=-1.929 to 3.186 Salinity: Median=35.161, Mean=35.094+- 0.245, Range=34.166 to 35.455 Velocity: Median= 7.20, Mean= 7.40+- 4.13, Range= 0.2 to 27.0 missing values: 444 U-Velocity: Median= -0.41, Mean= -0.43+- 3.33, Range= -13.1 to 12.2 MKE: 0.2 EKE: 11.1 V-Velocity: Median= -5.59, Mean= -4.86+- 6.08, Range= -25.5 to 26.9 MKE: 23.6 EKE: 36.9 Tides (snr>2): No. tide Period major emaj minor emin inc pha 4 O1 25.82 0.82 0.13 0.14 0.12 102.4 198.1 12 NO1 24.83 0.17 0.08 -0.03 0.09 86.8 224.3 5 P1 24.07 0.71 0.14 0.09 0.14 109.7 279.2 2 K1 23.93 1.52 0.15 0.27 0.14 107.6 267.2 11 PHI1 23.80 0.21 0.13 -0.00 0.12 140.2 83.3 9 MU2 12.87 0.32 0.20 -0.13 0.19 64.6 8.9 8 N2 12.66 0.51 0.25 -0.17 0.19 73.5 73.9 1 M2 12.42 2.92 0.26 -0.86 0.21 73.6 94.0 10 MKS2 12.39 0.29 0.18 -0.05 0.17 68.4 257.8 6 L2 12.19 0.63 0.28 -0.38 0.26 109.4 89.4 3 S2 12.00 0.92 0.23 -0.24 0.19 76.9 132.0 7 K2 11.97 0.60 0.19 -0.37 0.18 85.7 142.1 13 M4 6.21 0.09 0.06 -0.00 0.06 169.9 182.2 14 2MN6 4.17 0.07 0.03 0.01 0.04 26.5 167.7 after 30h low pass filter: U-Velocity: Median= -0.15, Mean= -0.42+- 2.79, Range= -10.2 to 11.0 MKE: 0.2 EKE: 7.8 V-Velocity: Median= -5.59, Mean= -4.85+- 5.25, Range= -20.0 to 24.0 MKE: 23.6 EKE: 27.5 FILE: fs2003/rcm12644.nc Start date: 06-Sep-2002 14:00:56 Stop date: 07-Sep-2003 06:02:49 No. of cycles: 4389 Sampling intervall: 120 minutes Temperature: Median= 2.086, Mean= 2.119+- 0.530, Range= 0.197 to 3.524 Salinity: Median=35.071, Mean=35.066+- 0.058, Range=34.862 to 35.204 Velocity: Median= 9.24, Mean= 10.11+- 6.63, Range= 0.0 to 41.8 U-Velocity: Median= -1.61, Mean= -1.87+- 6.18, Range= -26.7 to 21.9 MKE: 3.5 EKE: 38.2 V-Velocity: Median= -5.83, Mean= -6.15+- 8.17, Range= -41.8 to 20.0 MKE: 37.8 EKE: 66.7 Tides (snr>2): No. tide Period major emaj minor emin inc pha 4 O1 25.82 0.93 0.23 0.09 0.26 96.9 200.1 7 P1 24.07 0.41 0.21 0.20 0.22 84.0 250.9 2 K1 23.93 1.61 0.23 0.12 0.24 101.5 262.5 5 N2 12.66 0.52 0.24 -0.08 0.23 81.6 90.8 1 M2 12.42 2.99 0.25 -0.76 0.26 76.8 98.4 3 S2 12.00 1.17 0.20 -0.28 0.24 91.4 156.9 8 R2 11.98 0.33 0.17 -0.25 0.16 110.6 151.9 6 K2 11.97 0.46 0.19 -0.19 0.20 77.0 138.9 after 30h low pass filter: U-Velocity: Median= -1.72, Mean= -1.87+- 5.89, Range= -24.2 to 19.4 MKE: 3.5 EKE: 34.7 V-Velocity: Median= -5.94, Mean= -6.15+- 7.55, Range= -36.6 to 16.4 MKE: 37.8 EKE: 57.0 FILE: fs2003/rcm12646.nc Start date: 06-Sep-2002 09:59:04 Stop date: 08-May-2003 18:05:38 No. of cycles: 2933 Sampling intervall: 120 minutes Temperature: Median=-1.645, Mean=-1.484+- 0.599, Range=-1.895 to 3.398 Salinity: Median=34.080, Mean=33.942+- 0.727, Range=32.236 to 35.138 Velocity: Median= 15.05, Mean= 17.63+- 11.59, Range= 0.4 to 59.2 missing values: 521 U-Velocity: Median= -1.16, Mean= -1.64+- 8.60, Range= -37.5 to 28.0 MKE: 2.7 EKE: 74.0 V-Velocity: Median=-13.12, Mean=-14.44+- 12.64, Range= -50.5 to 22.3 MKE: 208.6 EKE: 159.7 Tides (snr>2): No. tide Period major emaj minor emin inc pha 1 SSA 4382.91 8.49 3.12 2.63 2.57 98.2 242.1 3 MSF 354.37 3.93 2.52 0.42 3.17 147.7 45.6 7 O1 25.82 0.79 0.32 0.37 0.31 112.8 214.2 8 P1 24.07 0.75 0.38 0.18 0.34 102.5 263.0 5 K1 23.93 1.38 0.34 0.34 0.34 106.3 268.1 10 PHI1 23.80 0.46 0.29 -0.16 0.31 123.2 193.6 2 M2 12.42 4.42 0.53 -2.39 0.59 70.2 86.4 6 LDA2 12.22 0.89 0.42 -0.73 0.43 28.4 90.4 4 S2 12.00 2.16 0.49 -1.33 0.52 82.5 139.3 9 K2 11.97 0.66 0.42 -0.48 0.47 106.7 149.3 after 30h low pass filter: U-Velocity: Median= -1.04, Mean= -1.64+- 7.75, Range= -27.8 to 24.6 MKE: 2.7 EKE: 60.1 V-Velocity: Median=-12.39, Mean=-14.44+- 11.69, Range= -46.9 to 16.7 MKE: 208.5 EKE: 136.5 FILE: fs2003/rcm12733.nc Start date: 06-Sep-2002 14:00:56 Stop date: 07-Sep-2003 05:57:11 No. of cycles: 4389 Sampling intervall: 120 minutes Temperature: Median=-0.625, Mean=-0.621+- 0.088, Range=-0.806 to -0.422 Velocity: Median= 4.59, Mean= 5.34+- 4.27, Range= 0.0 to 24.9 U-Velocity: Median= -0.53, Mean= -0.63+- 2.74, Range= -16.2 to 12.7 MKE: 0.4 EKE: 7.5 V-Velocity: Median= -1.60, Mean= -2.36+- 5.77, Range= -24.1 to 17.1 MKE: 5.6 EKE: 33.3 Tides (snr>2): No. tide Period major emaj minor emin inc pha 4 O1 25.82 0.74 0.10 0.09 0.09 98.5 206.5 8 PI1 24.13 0.15 0.10 0.01 0.09 99.5 246.8 5 P1 24.07 0.48 0.10 0.03 0.09 105.1 256.1 2 K1 23.93 1.56 0.10 0.23 0.08 95.8 263.5 6 N2 12.66 0.40 0.17 -0.02 0.11 72.9 67.0 1 M2 12.42 2.32 0.16 -0.09 0.10 84.7 103.8 3 S2 12.00 0.83 0.14 -0.05 0.11 82.1 135.7 7 K2 11.97 0.17 0.12 0.07 0.09 109.3 189.2 after 30h low pass filter: U-Velocity: Median= -0.55, Mean= -0.63+- 2.57, Range= -15.8 to 11.9 MKE: 0.4 EKE: 6.6 V-Velocity: Median= -2.19, Mean= -2.36+- 5.20, Range= -22.4 to 12.7 MKE: 5.6 EKE: 27.1 FILE: fs2003/rcm834.nc Start date: 06-Sep-2002 13:58:08 Stop date: 07-Sep-2003 05:48:45 No. of cycles: 4389 Sampling intervall: 120 minutes Pressure: Median= 53, Mean= 56+- 9.9, Range= 51 to 190 Temperature: Median=-1.378, Mean=-0.410+- 1.718, Range=-1.881 to 5.382 Salinity: Median=34.253, Mean=34.233+- 0.331, Range=32.829 to 34.890 Velocity: Median= 12.54, Mean= 14.97+- 9.60, Range= 0.0 to 53.5 U-Velocity: Median= -4.70, Mean= -4.70+- 8.64, Range= -33.1 to 26.9 MKE: 22.1 EKE: 74.7 V-Velocity: Median= -8.35, Mean= -9.76+- 11.15, Range= -53.3 to 19.5 MKE: 95.3 EKE: 124.2 Tides (snr>2): No. tide Period major emaj minor emin inc pha 1 MM 661.31 3.76 2.61 -0.52 2.95 22.6 234.0 5 O1 25.82 0.93 0.31 0.09 0.28 104.4 208.8 3 K1 23.93 1.51 0.30 0.10 0.24 95.5 257.6 2 M2 12.42 3.48 0.47 -1.43 0.50 73.8 91.1 6 LDA2 12.22 0.79 0.44 -0.71 0.45 179.9 291.2 4 S2 12.00 1.26 0.46 -0.52 0.49 100.7 174.3 7 K2 11.97 0.51 0.34 -0.34 0.37 127.5 170.9 after 30h low pass filter: U-Velocity: Median= -4.40, Mean= -4.70+- 8.01, Range= -27.3 to 23.5 MKE: 22.1 EKE: 64.1 V-Velocity: Median= -8.25, Mean= -9.76+- 10.36, Range= -50.2 to 14.4 MKE: 95.3 EKE: 107.4 FILE: fs2003/rcm836.nc Start date: 03-Sep-2002 12:00:00 Stop date: 08-Sep-2003 11:43:08 No. of cycles: 4441 Sampling intervall: 120 minutes Pressure: Median= 53, Mean= 53+- 0.4, Range= 52 to 59 Temperature: Median=-1.635, Mean=-1.642+- 0.163, Range=-1.874 to -0.967 Salinity: Median=33.417, Mean=33.274+- 0.585, Range=31.741 to 34.126 Velocity: Median= 8.16, Mean= 9.30+- 5.67, Range= 0.0 to 38.6 U-Velocity: Median= -1.42, Mean= -1.47+- 7.16, Range= -35.3 to 33.0 MKE: 2.1 EKE: 51.3 V-Velocity: Median= -1.26, Mean= -1.19+- 7.99, Range= -34.5 to 37.2 MKE: 1.4 EKE: 63.9 Tides (snr>2): No. tide Period major emaj minor emin inc pha 2 SA 8766.23 3.32 1.87 -0.80 1.14 68.7 238.7 3 SSA 4382.91 2.55 1.73 -0.18 1.17 112.2 348.2 8 O1 25.82 0.57 0.34 -0.24 0.41 163.4 277.2 6 K1 23.93 1.21 0.44 -0.35 0.43 148.2 328.2 5 N2 12.66 1.33 0.53 -0.83 0.64 56.3 22.8 7 H1 12.44 1.08 0.55 -0.58 0.59 138.8 51.2 1 M2 12.42 5.69 0.72 -3.86 0.73 41.7 68.6 4 S2 12.00 1.41 0.52 -0.60 0.61 54.6 116.1 after 30h low pass filter: U-Velocity: Median= -1.36, Mean= -1.46+- 3.47, Range= -19.9 to 7.5 MKE: 2.1 EKE: 12.0 V-Velocity: Median= -1.54, Mean= -1.19+- 5.18, Range= -19.8 to 18.8 MKE: 1.4 EKE: 26.9 FILE: fs2003/sbe1253.nc Start date: 03-Sep-2002 11:00:56 Stop date: 08-Sep-2003 14:00:56 No. of cycles: 8884 Sampling intervall: 60 minutes Pressure: Median= 50, Mean= 50+- 0.4, Range= 49 to 56 Temperature: Median=-1.620, Mean=-1.629+- 0.169, Range=-1.860 to -0.981 Salinity: Median=33.393, Mean=33.272+- 0.589, Range=32.005 to 34.176 FILE: fs2003/sbe2413.nc Start date: 06-Sep-2002 15:00:00 Stop date: 07-Sep-2003 06:00:00 No. of cycles: 8776 Sampling intervall: 60 minutes Pressure: Median= 50, Mean= 53+- 9.9, Range= 48 to 193 Temperature: Median=-1.366, Mean=-0.409+- 1.712, Range=-1.865 to 5.538 Salinity: Median=34.213, Mean=34.217+- 0.372, Range=32.779 to 36.041