Cruise Report
Fram Strait September 2003 Cruise on R/V Lance
Edmond H. Hansen
Norwegian Polar Institute
1. General information
The Fram Strait September 2003 cruise was performed with R/V Lance in the period 7 to 27 September. The purpose of the cruise was to acquire hydrographic data across the Fram Strait (CTD, ADCP) along the monitoring line on 78° 50' N, and along various sections in the strait. The purpose was also to recover the existing five moorings in the East Greenland Current (EGC) and replace them with new.
Cruise participants:
Edmond Hansen, NPI (cruise leader, data responsible)
Ole Anders Nøst, NPI
Pål Erik Isachsen, NPI
Kristen Fossan, NPI
Marika Marnela, FIMR
Harvey Goodwin, NPI (first leg)
Jürgen Holfort, AWI/IfM Hamburg (first leg)
Jean-Claude Gascard, LODYC (second leg)
Jacky Lanoiselle, LODYC (second leg)
Lance captain was Hermod Isaksen.
2. Moorings
2. 1 Recovered morings
Mooring F11-5, F-14-5 and FNY were recovered in good shape. Mooring F12-5 and F13-5 was lost. The upper 250 meter of F12 was found by sealers near the island of Jan Mayen in April 2003, except the ES300 and DCM12 on the very top. Hence two current meters were recovered; RCM7 sn12646 and sn12643. The instruments were severely damaged (most likely destroyed), but the data was intact. No contact could be made with the acoustic releaser on the mooring position, and dredging for remnants of the mooring gave no result.
The releaser of F13 was in position and communicated with the deck unit. It signalled its location and verified its release, but no mooring surfaced. Dredging was performed in three rounds over several hours, but without success.
The details of the recovered moorings are summarized in Table 1 below. Lost instruments are highlighted with red fonts. A visual impression and overview of the setup of the recovered moorings is given in Appendix 1, where drawings of the mooring configuration are provided.
NPI has maintained an array of moorings in this location since 1990, and have, except for the loss of an entire mooring in 2002, not experienced any significant losses (to the knowledge of the author of this report). However, on this particular cruise extraordinary many tabular icebergs were observed. Hundred to two hundred meter deep icebergs were seen floating in the horizon across the East Greenland shelf on 78° 50`` N. Figure 1 illustrates a typical observation. The Danish Meteorological Institute reports the same observation on a cruise with coast guard vessel Triton to this area earlier in September this year.
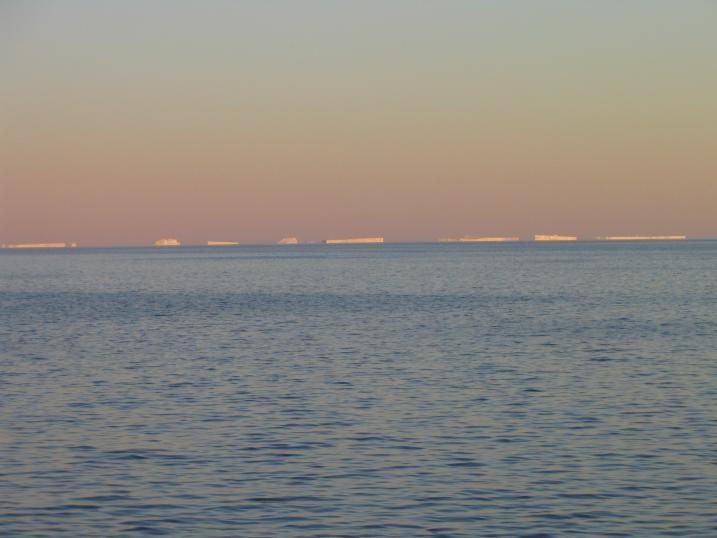
Figure 1: Icebergs in the horizon on the East Greenland shelf
Although it is impossible to find the cause of the recent losses, it is clear that a collision with one of the many icebergs in the area is a likely candidate. Such collisions have earlier not been a problem, as icebergs are few in this area. However, in some years the floating glacier shelves on the East Greenland fjords may disintegrate and drift out on the shelf. This is connected to the existence of fast ice, which tend to keep the floating glaciers in place (see Reeh, Thomsen, Higgins and Weidick, 2001. Sea ice and the stability of north and northeast Greenland floating glaciers, Annals of Glaciology, Vol. 33 2001, pp.474-480). As observed from Lance, there were no or very little fast ice at the coast this particular year.
Since it is likely that we are presently in a climate regime which allows the floating glaciers to disintegrate and drift away from the coast, we must reconsider our mooring configuration in order to avoid future losses. Preliminary discussions during the cruise seem to lead to the conclusion that the top of the moorings should be located deeper, and maybe even be built into a protecting shell.
Table 1: Recovered moorings in the Fram Strait September 2003
|
Mooring |
Latitude Longitude |
Water depth (m) |
Date and time of deployment |
Instrument type |
Serial number |
Instrument depth (m) |
|
F11-5 |
78° 49.963 N 03° 16.740 W |
2360 |
07.09.2002 13:20 |
ES300 DCM12 SBE16 RCM9 RCM7 RCM8 RCM8 |
48 17 2413 834 12644 12733 10069 |
41 41 49 50 243 1445 2351 |
|
F12-51 |
78° 49.578 N 04° 03.597 W |
1829 |
07.09.2002 10:40 |
ES3001 DCM121 RCM7 RCM7 RCM81 SBE371 RCM81 |
44 47 12646 12643 12587 443 12732 |
46 46 55 307 1509 1814 1820 |
|
F13-52 |
78° 49.580 N 05° 00.600 W |
980 |
05.09.2002 08:50 |
ES3002 DCM122 SBE162 RCM72 RCM72 RCM82 |
32 134 1974 9465 9708 10873 |
43 43 55 56 238 970 |
|
F14-5 |
78° 49.152 N 06° 27.538 W |
282 |
04.09.2002 10:30 |
ES300 SBE16 RCM9 RCM8 |
17 1253 836 11889 |
51 59 60 272 |
|
FNY3 |
78° 49.951 N 05° 24.654 W |
605 |
04.09.2002 13:10 |
RCM7 RCM11 |
11059 117 |
95 598 |
1 Remnants of mooring F12-5 were found by sealers near the island of Jan Mayen in April 2003. The top 250 m of the mooring was recovered, except the ES300 and DCM12 which was lost. Two RCM8 were also lost, while two RCM7 were recovered by the sealers and brought to NPI
2 Mooring F13-5 was lost
3 Mooring FNY was deployed as a test on how well we are able to resolve the EGC with the present configuration of the mooring array
2. 2 Deployed moorings
Seven new moorings were deployed to replace the recovered ones, and to extend the measurements onto the shelf. F11-6 to F14-6 were deployed as before over the EGC, while three new moorings were deployed on the shelf; F17 to F19.
 F11 to F14 has very much the same configuration
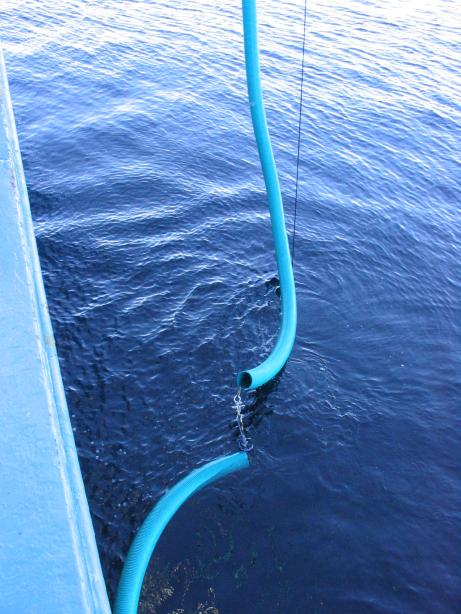
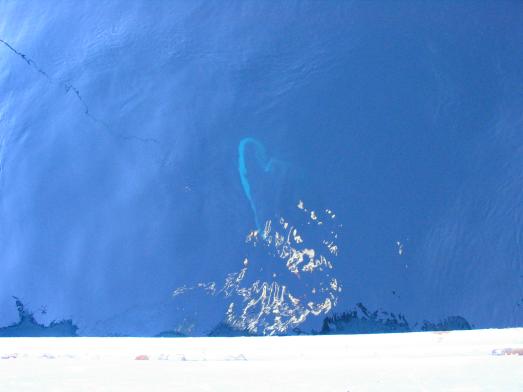
as in previous years. F17 is a test of a kind of tube mooring, where
two Microcats are placed inside a flexible fibre reinforced hose. The
upper end of the hose is only ten meters below the surface. However,
two major errors were done in the construction and deployment of this
mooring: First, the hose was cut in three parts to make the procedure
of mounting flotation and instruments inside it simpler. The strength
of the mooring is hence reduced, since this creates edges and openings
where ice can get hold of the mooring. Secondly, the mooring was
mounted upside down during the deployment, so that the top flotation
was located at the bottom. Hence the tube is not able to stand
properly up in an upright position. Figure 2 and 3 demonstrates this
mooring, see also Appendix 2.
F11 to F14 has very much the same configuration
as in previous years. F17 is a test of a kind of tube mooring, where
two Microcats are placed inside a flexible fibre reinforced hose. The
upper end of the hose is only ten meters below the surface. However,
two major errors were done in the construction and deployment of this
mooring: First, the hose was cut in three parts to make the procedure
of mounting flotation and instruments inside it simpler. The strength
of the mooring is hence reduced, since this creates edges and openings
where ice can get hold of the mooring. Secondly, the mooring was
mounted upside down during the deployment, so that the top flotation
was located at the bottom. Hence the tube is not able to stand
properly up in an upright position. Figure 2 and 3 demonstrates this
mooring, see also Appendix 2.
 F18 is a mooring containing only
an ADCP on 122 meters depth. F19 is a
“regular” tube mooring manufactured
by the IfM Hamburg, with two Microcats inside. This mooring is a
joint mooring by IfM, AWI and NPI. Responsible scientist here was
Jürgen Holfort from IfM/AWI, now at NPI.
F18 is a mooring containing only
an ADCP on 122 meters depth. F19 is a
“regular” tube mooring manufactured
by the IfM Hamburg, with two Microcats inside. This mooring is a
joint mooring by IfM, AWI and NPI. Responsible scientist here was
Jürgen Holfort from IfM/AWI, now at NPI.
Details on the deployed moorings are found in Table 2 below, while drawings of the configurations are provided in Appendix 2.
Table 2: Deployed moorings
|
Mooring |
Latitude Longitude |
Water depth (m) |
Date and time of deployment |
Instrument type |
Serial number |
Instrument depth (m) |
|
F11-6 |
78° 49.921 N 03° 16.077 W |
2376 |
14.09.2003 15:40 |
ES300 DCM12 SBE16 RCM9 RCM7 RCM11 RCM8 |
19 190 4321 1046 11475 228 10071 |
65 65 73 74 259 1462 2365 |
|
F12-6 |
78° 49.770 N 04° 02.868 W |
1841 |
14.09.2003 10:50 |
ES300 SBE37 RCM7 RCM7 RCM11 RCM8S |
52 2963 11854 10349 234 11625 |
70 72 91 325 1528 1831 |
|
F13-6 |
78° 50.728 N 05° 00.994 W |
980 |
13.09.2003 16:00 |
ES300 DCM12 SBE37 RCM7 RCM11 RCM8 |
51 17 2962 7718 235 12733 |
47 47 48 57 227 1014 |
|
F14-6 |
78° 48.996 N 06° 26.915 W |
282 |
12.09.2003 07:15 |
ES300 SBE16 RCM9 RCM8 |
37 4322 834 12644 |
88 98 99 273 |
|
F17 (FnyA) |
78° 49.818 N 08° 59.251 W |
238 |
11.09.2003 12:20 |
ADCP |
727 |
122 |
|
F181 (FnyB) |
78° 49.953 N 08° 54.146 W |
246 |
11.09.2003 14:40 |
SBE37 SBE37 |
2813 2814 |
|
|
F192 |
78° 49.821 N 12° 29.876 W |
189 |
11.09.2003 05:00 |
SBE37 SBE37 AWI releaser |
2967 2942 207 |
Upper Lower |
1F18 (FnyB) was deployed upside down due to a mistake. This changed the location of the flotation in the mooring, and thereby its vertical shape. Final instrument depth uncertain, check pressure sensors
2Joint IfM Hamburg/NPI/AWI mooring. Responsible: Jürgen Holfort
3. CTD stations
96 CTD stations were taken. All CTD stations are plotted in Fig. 4. A complete CTD station list is enclosed in Appendix 3.
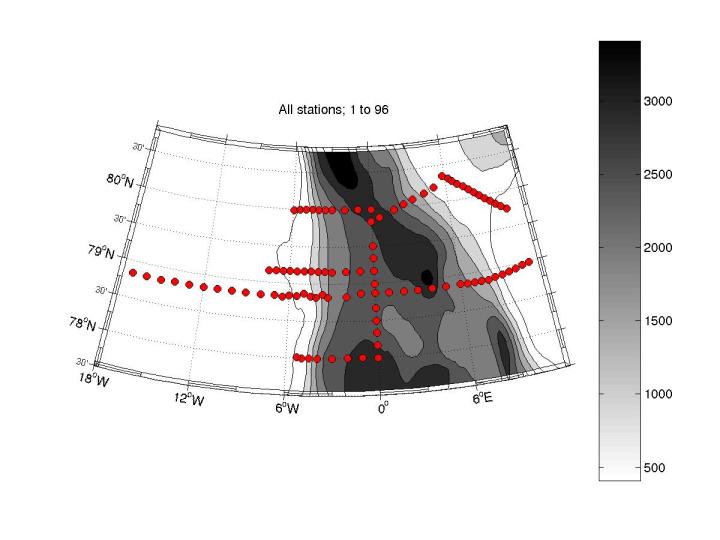
Figure 4. The position of all CTD stations
The measurements were taken with a standard Seabird SBE 9 CTD with a SBE 11+ deck unit. The temperature and conductivity sensors came directly from calibration. There were no major problems with the equipment. One to three salinity samples were taken on each station for calibration purposes.
4. ADCP
The ADCP was switched on on the westernmost point of the cruise, near Greenland. It therefore logged during the complete across-Fram Strait-section, and was left on until the meridional section ended. No processing or analysis of the data has been performed during the cruise.
5. Sea ice work
The sea ice work was led by H.Goodwin (NPI) under the internal NPI project "Surface properties and thickness of multi-year sea ice in the Fram Strait for calibration/validation of CRYOSAT" (PI: S. Gerland, NPI). The basic idea of this project is to gain detailed in situ ice thickness and related information for the locations in the western Fram Strait, the area where the four NPI-ULS moorings are installed. As one product, ice thickness distribution functions can be calculated from electromagnetic profiling and later compared with ice draft distributions for the same locations, derived from ULS measurements. Those data will be important for calibration and validation of the CRYOSAT mission.
In total work on 6 sea ice stations was conducted during this cruise (see table below).
|
Sea ice Station |
Date |
Latitude |
Longitude |
Number of thickness drillings |
EM profiles (length in m) |
|
1 |
08-SEP-03 |
78 50.882 N |
5 1.818 W |
1 |
1 (50) |
|
2 |
09-SEP-03 |
78 49.557 N |
6 26.688 W |
4 |
1 (88) |
|
3 |
11-SEP-03 |
78 48.895 N |
4 55.927 W |
3 |
1 (37) |
|
4 |
11-SEP-03 |
78 48.557 N |
4 54.265 W |
- |
1 (100) |
|
5 |
13-SEP-03 |
78 49.617 N |
5 0.912 W |
3 |
1 (50) |
|
6 |
13-SEP-03 |
78 50.165 N |
5 2.506 W |
3 |
1 (40) |
|
6 |
|
|
|
14 |
365 m |
Depending on available station time and station settings, several or all of the following investigations and measurements were applied: Ice thickness drillings, snow thickness sounding, freeboard measurement in boreholes and at the sea ice floe edges, electromagnetic profiling for the indirect measurement of total ice thickness (using NPI's Geonics EM31 instrument), surface water salinity measurement, and surface snow crystal characterization. The table above lists the length of EM31 profiles in the last column.
In addition, as for previous cruises with RV "Lance" , regular ice observations were undertaken every 3 hrs. from the bridge, using a standardised scheme, which includes e.g. the different appearing ice classes and estimates of ice concentration. Those observations are consecutively implemented in NPI's GIS database with shipboard sea ice observations.
For 2004, a continuation and extension of the in situ sea ice work with a larger amount of measurements is planned.
6. Cruise log
|
Date |
Activity |
|
Sun 7/9 |
Departure Longyearbyen 1000 UTC Steaming toward F11 |
|
Mon 8/9 |
Arrival F11-5 0600 UTC. F11 on deck 0740 UTC Arrival F12 -51100 UTC. No contact, F12 lost Arrival F13-5 1500 UTC. Communicates, does not release. Dredging 1600-2100. No result Sea ice station 1, 1600-1930 UTC CTD stations 001 to 004 |
|
Tue 9/9 |
Dredging for F13-5 0800-0945 UTC. Arrival FNY 1030. FNY on deck 1110 Arrival F14-5 1400 UTC. F14 on deck 1425 UTC Sea ice station 2 CTD stations 005 to 010 |
|
Wed 10/9 |
Steaming/CTD westward CTD stations 011 to 018 |
|
Thu 11/9 |
F19 deployed 0500 UTC F17 (FnyA) deployed 1020 UTC F18 (FnyB) deployed 1240 Sea ice stations 3 & 4 |
|
Fri 12/9 |
F14-6 deployed 0710 UTC CTD stations 019 to 028 |
|
Sat 13/9 |
F13-6 deployed 1405 UTC Dredging for F13-5 1600-1900 CTD stations 029 to 031 Sea ice stations 5 & 6 |
|
Sun 14/9 |
F12-6 deployed 1150 UTC F11-6 deployed 1350 UTC CTD stations 032 to 035 |
|
Mon 15/9 |
CTD stations 036 to 046 |
|
Tue 16/9 |
CTD stations 047 to 049 Arrival Ny-Ålesund 0530 Changing scientific crew Fixing hydraulic system Loading of cargo Steaming for Yermak Plateau 1600 UTC |
|
Wed 17/9 |
CTD stations 050 to 067 |
|
Thu 18/9 |
CTD stations 068 to 073 |
|
Fri 19/9 |
CTD stations 074 to 079 |
|
Sat 20/9 |
CTD stations 080 to 085 |
|
Sun 21/9 |
CTD stations 086 to 094 |
|
Mon 22/9 |
CTD stations 094 to 096 Steaming toward LODYC mooring deployment site SW of Spitsbergen |
|
Tue 23/9 |
CTD station 097 LODYC mooring deployment |
|
Wed 24/9 |
Steaming south toward LODYC floats |
|
Thu 25/9 |
Steaming south toward LODYC floats Recovery float 1 Recovery float 2 |
|
Fri 26/9 |
Steaming Recovery float 3 |
|
Sat 27/9 |
Steaming toward Tromsø Arrival Tromsø 0600 UTC |
Appendix 1:
Drawings of recovered moorings