18th May - 04th June 2005
Report prepared by: Vladimir Pavlov, Harvey Goodwin, Jürgen Holfort, Kristen Fossan, Olga Pavlova, Marzena Kaczmarska and Roman Vlasenkov
Funded by
Norsk Polarinstitutt
Cruise track and station positions
Station information and Water sampling (Table 1)
Temperature and salinity distribution at the transects through the West Spitsbergen Current
Some comparisons between Lance CTD observations and historical hydrography in the Fram Strait
Measurements of the relative seawater transparency
Cruise Leader
Vladimir Pavlov
Norsk Polarinstitutt
Tromsø, Norway
pavlov@npolar.no
Scientists:
Harvey Goodwin
Norsk Polarinstitutt
Tromsø, Norway
goodwin@npolar.no
Jürgen Holfort
Norsk Polarinstitutt
Tromsø, Norway
holfort@npolar.no
Olga Pavlova
Norsk Polarinstitutt
Tromsø, Norway
olga@npolar.no
Marzena Kaczmarska
Norsk Polarinstitutt
Tromsø, Norway
marzena.kaczmarska@npolar.no
Engineer
Kristen Fossan
Norsk Polarinstitutt
Tromsø
kfossan@npolar.no
PhD student
Roman Vlasenkov
Arctic and Antarctic Research Institute
St.Petersburg, Russia
vlasenkov@list.ru
Our survey of the Fram Strait continues the annual NP hydrographic observation and monitoring of ice in this region.
The locations of the profiles were at the positions of the stations performed in grid survey of FRAM2005 expedition plan (see Fig.1). The Lance CTD stations were a mixture of near full depth (3500 m) and shallower depth (100m) stations.
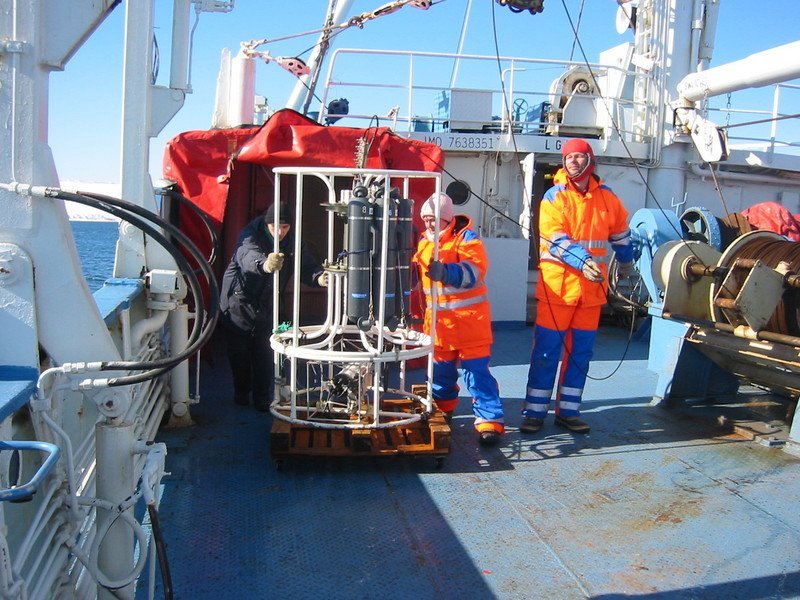
Additional stations extending this grid were also performed (Transect 7: Sts. 51-59) as well as CTD stations near ice stations. All data were acquired using aSeabird 911 plus fitted with a Seabird, pressure, temperature, conductivity cell and pump. The CTD was installed at the bottom of a CTD frame which included a carousal water sampler above it. Water samples for salinity calibration were obtained at most stations (See Table 1 for full listing).The ADCP records were obtained throughout the cruise.
During the cruise CTD data was transmitted to KV Svalbard and H.U.Sverdrup II.
Fig. 1 CTD station layout - bathymetry.
Red circles: Lance CTD stations
Green circles: H. U. Sverdrup II CTD stations
Yellow circles: Helicopter CTD stations from KV Svalbard
Red squares: NPI moorings
Black rectangle: Likely operating area of KV Svalbard, depending
on sea ice conditions.
10 ice stations were visited. 6 in the MIZ near 79°N and between 0°W and 2°W, and 4 stations in the MIZ northwest of Svalbard at approximately 80°N. The main aim of the ice station work was to obtain data regarding ice thickness from representative large ice floes in the Fram Strait. In addition temperature and salinity samples were taken along with physical properties of the snow cover.
Lance is also equipped with an automatic weather station which records meteorological parameters and digital photographs every 5 minutes which are used to calculate sea ice concentration. Navigational parameters are also recorded in parallel.
To aid our operational efficiency ice charts and satellite imagery were obtained daily via email.
At each CTD station Sekki disk observations of relative seawater transparency was carried out.
Below is a map showing the location of all CTD and Ice stations performed during the cruise.
Fig.2 Cruise track and station positions
In the beginning of the cruise, on 19th May at 11:00, the successful recovery of the University Pierre et Marie Curie mooring station was undertaken. The mooring was deployed in 2003. The depth and position are noted in table below.
|
Date |
Depth |
Lat. |
Long. |
|
2003 |
2662 |
76 58.463N |
008 04.516E |
In order to obtain round the clock
CTD
data the scientific personnel was divided into two groups. Team 1
(Vladimir, Kristen and Roman) performed the 6 to 12 shift whilst
Team 2 (Jürgen and Olga) ran the 12 - 6 shift. In the calm
weather the swinging of the CTD was not a problem. When the
weather was bad an extra person from the crew or Harvey or Roman
helped Team 2 with this procedure and we are indebted to them for
their help.
Once in the water the logging was initiated using SeaSave the Seabird data acquisition software. The salinity and temperature values were monitored until they were stable and then the CTD was lowered at about 1m/s. Water samples were fired& on the upcast.
At the end of a station the CTD was taken back on deck, wheeled into the shelter where it could be fastened to the ship before Lance headed to the next station. After which the data was downloaded, changed to ASCII using Data Conversion (DatConv) on the SBE data processing software. The resultant CNV file was used for plotting of TS vertical profiles and transects. At this stage no other processing was performed to the data.
The main thrust of the cruise was to characterise the oceanographic properties of the Eastern part of the Fram Strait. In particular it was to identify and survey features of the West Spitsbergen Current. In order to identify the Atlantic water masses there were performed 8 transects through the West Spitsbergen Current (Fig.2). The CTD data from these transects (Fig. 3-10) allowed us to identify pathways of the Atlantic waters and reconstruct the main branches of the West Spitsbergen Current (Fig. 11). In the core the temperature is changing from 5.1-5.2 at latitudes 76 30N - 77N to 3.4-4.3 at the latitudes 80N-80 30N. At the latitude 79 30N the branching of the West Spitsbergen Current occurs. Eastern branch turns over Svalbard trough Yermak Plateau along isobaths 500 m and its western branch follows to the north.
Figures 12-22 shows vertical profiles of the potential temperature and salinity at the stations in the branches of the West Spitsbergen Current.
Table. 1 Water sampling and Station information
|
Stn Number |
Stn. Num. FRAM-2005 plan (Fig. 1) |
Date |
Time |
Latitude |
Longitude |
Pressure |
Temperature |
Salinity |
Bottles |
Comment |
|
1 |
9 |
19/05/05 |
19:25 |
76 29.95 |
011 30.00E |
2000 100.8 |
-0.857 -4.0578 |
34.4069 35.1213 |
1 2 |
Start of grid |
|
2 |
8 |
19/05/05 |
21:55 |
76 29.92 |
011 59.86E |
1896 248 |
-0.8615 3.3448 |
34.9062 35.0390 |
3 4 |
|
|
3 |
7 |
20/05/05 |
01:00 |
76 30.00 |
012 30.00E |
1737 |
-0.872 |
34.907 |
5 |
|
|
4 |
6 |
20/05/05 |
10:55 |
76 30.00 |
012 59.68E |
1554 899 |
-0.881 -0.686 |
34.907 34.900 |
6 7 |
|
|
5 |
5 |
20/05/05 |
12:50 |
76 29.987 |
013 30.20E |
1268 103.4 |
-0.877 4.925 |
34.907 34.142 |
8 9 |
|
|
6 |
4 |
20/05/05 |
13:20 |
76 30.07 |
014 00.50E |
743.5 192 |
0.16 4.486 |
34.913 35.098 |
10 11 |
|
|
7 |
3 |
20/05/05 |
15:05 |
76 29.94 |
014 29.82E |
245.6 |
2.933 |
34.971 |
12 |
|
|
8 |
2 |
20/05/05 |
16:26 |
76 29.94 |
014 59.53E |
169.8 53.4 |
1.3680 1.6516 |
34.8491 34.7533 |
13 14 |
|
|
9 |
1 |
20/05/05 |
18:06 |
76 30.00 |
015 29.80E |
138.7 21.1 |
1.6544 -1.3350 |
34.8420 34.0802 |
15 16 |
|
|
10 |
10 |
21/05/05 |
04:30 |
77 29.90 |
012 29.90E |
92.3 |
1.9465 |
34.8021 |
17 |
|
|
11 |
11 |
21/05/05 |
05:30 |
77 29.90 |
011 59.90E |
135.5 |
3.4147 |
34.9863 |
18 |
|
|
12 |
12 |
21/05/05 |
06:40 |
77 29.90 |
011 30.00E |
257.6 32.4 |
3.6727 4.0735 |
35.0198 34.9962 |
19 20 |
|
|
13 |
13 |
21/05/05 |
07:55 |
77 29.90 |
010 59.90E |
798.4 |
1.6860 |
34.9611 |
21 |
|
|
14 |
14 |
21/05/05 |
09:30 |
77 30.00 |
010 30.00E |
1207 34.5 |
-0.872 5.101 |
34.907 35.139 |
22 23 |
|
|
15 |
15 |
21/05/05 |
11:30 |
77 29.97 |
009 59.96E |
1530 50 |
-0.871 5.197 |
34.907 35.150 |
24 25 |
|
|
16 |
21 |
21/05/05 |
18:45 |
78 20.00 |
008 29.70E |
1798 502.7 |
-0.853 3.0995 |
34.9069 35.2033 |
26 27 |
|
|
17 |
20 |
21/05/05 |
21:05 |
78 20.00 |
008 59.90E |
1196.3 301.8 |
-0.8304 3.4592 |
34.9064 35.0815 |
28 29 |
|
|
18 |
19 |
21/05/05 |
22:40 |
78 19.94 |
009 29.98E |
384 8 |
3.530 1.18 |
35.037 34.562 |
30 31 |
|
|
19 |
18 |
21/05/05 |
23:40 |
78 20.00 |
010 00.41E |
200 7 |
3.406 -0.007 |
34.978 34.269 |
32 33 |
|
|
20 |
17 |
22/05/05 |
00:40 |
78 20.06 |
010 30.20E |
Did not fire |
||||
|
21 |
16 |
22/05/05 |
01:22 |
78 20.01 |
011 00.20E |
14 |
-1.000 |
34.060 |
34 |
|
|
22 |
28 |
22/05/05 |
05:40 |
79 00.00 |
009 29.90E |
193.3 17.4 |
3.4096 -0.8147 |
35.0169 34.1767 |
35 36 |
|
|
23 |
27 |
22/05/05 |
06:35 |
79 00.00 |
010 00.30E |
252.8 |
3.0499 |
34.9532 |
37 |
|
|
24 |
26 |
22/05/05 |
07:30 |
79 00.00 |
010 30.00E |
262.7 |
1.5875 |
34.7727 |
38 |
|
|
25 |
25 |
22/05/05 |
8:30 |
79 00.00 |
011 00.00E |
262.3 |
3.1881 |
34.9637 |
39 |
|
|
26 |
24 |
22/05/05 |
09:40 |
78 58.9 |
011 41.96E |
313 |
1.540 |
34.7712 |
40 |
|
|
27 |
23 |
22/05/05 |
10:23 |
78 57.60 |
011 56.30E |
337 |
1.470 |
30.761 |
41 |
|
|
28 |
29 |
22/05/05 |
17:50 |
79 00.00 |
008 59.70E |
196.4 |
3.5387 |
35.0088 |
42 |
|
|
29 |
30 |
22/05/05 |
18:45 |
79 00.00 |
008 29.80E |
457.2 |
3.2762 |
35.0322 |
43 |
|
|
30 |
31 |
22/05/05 |
19:50 |
79 00.00 |
007 59.8E |
1053 236.6 |
-0.8730 3.2166 |
34.9064 35.0579 |
44 45 |
|
|
31 |
32 |
22/05/05 |
21:20 |
79 00.00 |
007 29.70E |
1204.9 262 |
-0.8492 3.208 |
34.9069 35.072 |
46 47 |
|
|
32 |
33 |
22/05/05 |
23:00 |
79 00.00 |
006 59.98E |
1215 10 |
-0.879 1.565 |
34.907 34.677 |
48 49 |
|
|
33 |
34 |
23/05/05 |
00:25 |
79 00.06 |
006 29.60E |
1418 120 |
-0.869 4.510 |
32.907 35.098 |
50 51 |
|
|
34 |
35 |
23/05/05 |
01:55 |
79 00.02 |
005 59.99E |
1843 236 |
-0.846 3.378 |
34.907 35.003 |
52 53 |
|
|
35 |
36 |
23/05/05 |
04:10 |
79 00.00 |
005 00.10E |
2404.3 741.2 |
-0.7815 0.0492 |
34.9196 34.9003 |
54 55 |
|
|
36 |
37 |
23/05/05 |
06:55 |
79 00.00 |
004 00.00E |
2583 753 |
-0.7613 0.3427 |
34.9212 34.9129 |
56 57 |
|
|
37 |
22 |
23/05/05 |
10:00 |
78 45.00 |
004 00.50E |
2314 11 |
-0.778 3.425 |
34.923 35.004 |
58 59 |
|
|
38 |
38 |
23/05/05 |
13:45 |
79 00.05 |
002 59.95E |
1440 11 |
-0.773 3.639 |
34.921 35.007 |
60 61 |
|
|
39 |
39 |
23/05/05 |
16:30 |
79 00.00 |
001 59.50E |
2296.5 795.5 |
-0.7904 -0.2088 |
34.9130 34.8978 |
62 none |
Did not fire |
|
40 |
40 |
23/05/05 |
19:30 |
79 00.00 |
000 59.30E |
2500 602 |
-0.8178 0.5632 |
34.9118 34.9230 |
63 64 |
|
|
41 |
41 |
23/05/05 |
22:15 |
79 00.20 |
000 01.00W |
2578 10 |
-0.777 -1.517 |
34.917 33.916 |
65 66 |
|
|
42 |
42 |
24/05/05 |
01:20 |
79 00.08 |
000 59.80W |
2635 11 |
-0.784 -1.735 |
34.426 33.855 |
67 none |
Did not fire |
|
43 |
43 |
24/05/05 |
08:45 |
78 59.06 |
001 58.30W |
2604.5 8 |
-0.7490 -1.681 |
34.9233 33.792 |
68 69 |
Ice station F05-L01 |
|
44 |
61 |
25/05/05 |
00:35 |
79 31.10 |
000 21.30E |
600 |
Did not fire. Ice station F05-L02 |
|||
|
45 |
60 |
25/05/05 |
05:10 |
79 30.00 |
001 00.60E |
3102.6 648.5 |
-0.7204 0.6877 |
34.9250 34.9057 |
70 71 |
|
|
46 |
59 |
25/05/05 |
08:25 |
79 30.00 |
002 00.00E |
2365.7 804 |
-0.7625 0.1053 |
34.9165 34.8940 |
none none |
Problem with bottles |
|
47 |
58 |
25/05/05 |
11:15 |
79 29.95 |
003 00.01E |
3533 9 |
-0.678 -1.19 |
34.925 33.978 |
72 none |
Did not fire |
|
48 |
57 |
25/05/05 |
15:10 |
79 29.96 |
003 59.96E |
3153 898.6 |
-0.7138 -0.070 |
34.9227 34.8963 |
73 74 |
|
|
49 |
72 |
26/05/05 |
22:30 |
80 16.90 |
006 18.00E |
556 107 |
1.917 3.424 |
34.995 34.981 |
none 75 |
Problem with bottles |
|
50 |
71 |
27/05/05 |
00:10 |
80 14.00 |
006 32.60E |
553 5 |
2.113 1.392 |
35.005 34.577 |
76 77 |
|
|
51 |
New |
27/05/05 |
02:35 |
80 10.30 |
007 30.70E |
620 |
0.478 |
34.925 |
none |
Problem with bottles |
|
52 |
New |
27/05/05 |
04:45 |
80 23.60 |
008 12.00E |
755 |
-0.2135 |
34.9089 |
78 |
|
|
53 |
New |
27/05/05 |
06:55 |
80 31.70 |
008 53.70E |
1232.1 199.5 |
-0.5748 2.4471 |
34.9053 34.9711 |
79 80 |
Ice station F05-L03 |
|
54 |
New |
27/05/05 |
14:40 |
80 35.90 |
009 46.70E |
1112 8.5 |
-0.629 -1.499 |
34.905 33.941 |
none 81 |
Problem with bottle Ice station F05-L04 |
|
55 |
New |
27/05/05 |
21:30 |
80 29.60 |
010 22.00E |
769.9 |
-0.1604 |
34.9096 |
82 |
|
|
56 |
New |
27/05/05 |
23:10 |
80 22.25 |
011 02.30E |
491 8 |
2.3000 0.696 |
35.000 34.565 |
83 84 |
|
|
57 |
New |
28/05/05 |
00:30 |
80 14.80 |
011 43.10E |
174 8 |
3.163 0.224 |
34.953 34.535 |
85 86 |
|
|
58 |
New |
28/05/05 |
01:40 |
80 07.40 |
012 22.50E |
183 12 |
2.921 -0.284 |
34.936 34.468 |
87 88 |
|
|
59 |
New |
28/05/05 |
02:45 |
80 00.04 |
013 00.30E |
185 8 |
2.236 0.309 |
34.841 34.551 |
89 90 |
|
|
60 |
63 |
28/05/05 |
06:30 |
79 45.00 |
010 20.20E |
107.1 |
3.527 |
35.0154 |
91 |
|
|
61 |
64 |
28/05/05 |
07:45 |
79 51.00 |
009 34.60E |
450.1 138.3 |
1.5695 3.9154 |
34.9755 35.0202 |
92 93 |
|
|
62 |
66 |
28/05/05 |
09:15 |
79 56.90 |
008 50.20E |
469 |
0.5573 |
34.9252 |
94 |
|
|
63 |
68 |
28/05/05 |
10:40 |
80 03.60 |
008 06.80E |
499 |
2.0750 |
35.003 |
95 |
|
|
64 |
69 |
28/05/05 |
12:10 |
80 09.60 |
007 20.70E |
541 8 |
2.058 1.214 |
35.003 34.555 |
96 97 |
|
|
65 |
70 |
28/05/05 |
17:00 |
80 12.10 |
005 58.50E |
665 |
0.5361 |
34.9380 |
98 |
Ice station F05-L05 |
|
66 |
67 |
28/05/05 |
23:50 |
80 01.70 |
005 29.50E |
952 |
-0.8320 |
34.907 |
99 |
Ice station F05-L06 |
|
67 |
65 |
29/05/05 |
03:55 |
79 54.40 |
004 59.20E |
1419 317 |
-0.8543 3.5151 |
34.9071 35.0719 |
100 101 |
|
|
68 |
62 |
29/05/05 |
06:20 |
79 42.00 |
004 29.70E |
2941 631.5 |
-0.7385 0.9005 |
34.9256 34.9304 |
102 103 |
|
|
69 |
45 |
29/05/05 |
10:50 |
79 15.30 |
004 00.40E |
2741 11.5 |
-0.7470 3.9380 |
34.9230 35.0830 |
104 105 |
|
|
70 |
56 |
29/05/05 |
14:50 |
79 20.00 |
004 59.60E |
2725 600 |
-0.7480 2.6525 |
34.9240 35.0325 |
106 107 |
|
|
71 |
55 |
29/05/05 |
17:10 |
79 30.00 |
005 30.00E |
2427 451.6 |
-0.8028 3.3147 |
34.9206 35.0853 |
108 109 |
|
|
72 |
54 |
29/05/05 |
19:20 |
79 30.20 |
006 00.10E |
1859.4 360.1 |
-0.8393 3.4240 |
34.9080 35.0679 |
110 111 |
|
|
73 |
53 |
29/05/05 |
21:00 |
79 30.00 |
006 30.30E |
1379.2 500 |
-0.8535 3.1728 |
34.9075 35.0678 |
112 113 |
|
|
74 |
52 |
29/05/05 |
22:30 |
79 30.00 |
007 00.30E |
1095 12 |
-0.7740 2.5820 |
34.9060 34.8360 |
114 115 |
|
|
75 |
51 |
29/05/05 |
23:50 |
79 30.05 |
007 30.40E |
860 10 |
-0.6800 2.3550 |
34.9050 34.7360 |
116 117 |
|
|
76 |
50 |
30/05/05 |
01:05 |
79 30.00 |
007 59.50E |
599 10 |
2.5900 2.2390 |
35.0300 34.7120 |
118 119 |
Too noise |
|
77 |
49 |
30/05/05 |
02:10 |
79 30.00 |
008 30.10E |
278 10 |
3.0370 0.5240 |
35.0610 35.5090 |
120 121 |
|
|
78 |
48 |
30/05/05 |
03:07 |
79 30.05 |
009 00.06E |
153 8 |
2.8040 0.6680 |
35.0450 34.5520 |
122 123 |
|
|
79 |
47 |
30/05/05 |
03:55 |
79 30.00 |
009 30.10E |
128 11 |
3.235 -0.257 |
35.0450 34.3770 |
124 125 |
|
|
80 |
46 |
30/05/05 |
04:40 |
79 30.00 |
010 00.10E |
74.6 |
1.2621 |
34.6854 |
126 |
|
|
81 |
44 |
30/06/05 |
08:00 |
79 01.20 |
011 25.80E |
336 |
2.4711 |
34.8903 |
127 |
|
|
82 |
New |
31/05/05 |
07:20 |
78 59.00 |
000 44.00W |
2598 |
-0.7576 |
34.9226 |
128 |
Ice station F05-L07 |
|
83 |
New |
31/05/05 |
11:40 |
79 04.60 |
001 22.91W |
1000 |
-0.2955 |
34.9014 |
none |
Problem with bottle. Ice station F05-L08 |
|
84 |
New |
01/06/05 |
07:10 |
78 58.50 |
001 58.70W |
1002 |
-0.2071 |
34.8974 |
129 |
Ice station F05-L09 |
Fig. 3 Temperature and salinity distribution at Transect 1
(transect location is shown in Fig. 2)
Fig. 4 Temperature and salinity distribution at Transect 2
(transect location is shown in Fig. 2)
Fig. 5 Temperature and salinity distribution at
Transect 3 (transect location is shown in Fig. 2)
Fig. 6 Temperature (upper panel) and salinity
(bottom panel) distribution at Transect 4 (transect location is
shown in Fig. 2)
Fig. 7 Temperature and salinity distribution at
Transect 5 (transect location is shown in Fig. 2)
Fig. 8 Temperature and salinity distribution at
Transect 6 (transect location is shown in Fig. 2)
Fig. 9 Temperature and salinity distribution at
Transect 7 (transect location is shown in Fig. 2)
Fig. 10 Temperature and salinity distribution at
Transect 8 (transect location is shown in Fig. 2)
Fig. 11 Reconstructed location of the main branches of the West
Spitsbergen Current
Fig. 12 Potential temperature and salinity
profiles at the standard levels
(Station number Fr02, Transect 1)
Fig. 13 Potential temperature and salinity
profiles at the standard levels
(Station number Fr05, Transect 1)
Fig. 14 Potential temperature and salinity
profiles at the standard levels
(Station number Fr15, Transect 2)
Fig. 15 Potential temperature and salinity
profiles at the standard levels
(Station number Fr18, Transect 3)
Fig. 16 Potential temperature and salinity
profiles at the standard levels
(Station number Fr34, Transect 4)
Fig. 17 Potential temperature and salinity
profiles at the standard levels
(Station number Fr56, Transect 7)
Fig. 18 Potential temperature and salinity
profiles at the standard levels
(Station number Fr61, Transect 6)
Fig. 19 Potential temperature and salinity
profiles at the standard levels
(Station number Fr63, Transect 6)
Fig. 20 Potential temperature and salinity
profiles at the standard levels
(Station number Fr67, Transect 8)
Fig. 21 Potential temperature and salinity profiles at the
standard levels
(Station number Fr71, Transect 5)
Fig. 22 Potential temperature and salinity
profiles at the standard levels
(Station number Fr77, Transect 5)
Our primary focus is on the section along 79ºN as this is a regular section surveyed by the September cruises in recent years and it also covers the largest part of the basin. An important task of these comparisons is the differentiation between seasonal and longer term changes. To see what part of the observed changes is due to seasonal variations we will compare the changes from September 2004 to May 2005 with changes from September 1998 to May 1999 and look for similarities. Both September cruises were done while servicing the NPI mooring array in the East Greenland current, the May 1999 cruise was a VEINS cruise (data from the VEINS CD-ROM).
Fig.23: Positions of the CTD stations used in the
comparison.
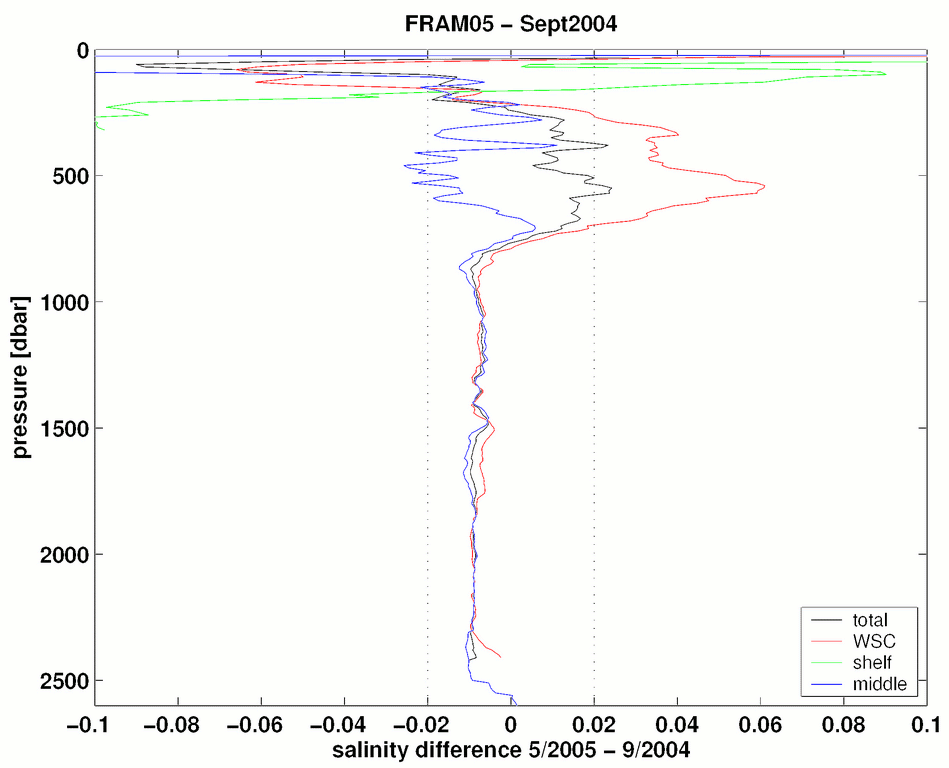
The individual sections were first interpolated onto a regular longitude-pressure grid (irrespective of latitude) and these grids were then used for the comparison. The latitudinal difference between sections is at most 10 minutes (Fig.23), the errors due to this separation should be small. As the difference sections (Fig.24) are quite noisy due to frontal shifts and eddy activity, means of different hydrographic regions were calculated. The 79ºN section was divided into three regions, a shelf region (east of 9ºE), the West-Spitsbergen current (3ºE-9ºE) and the mid Fram Strait (west of 3ºE till about 2ºW).
| 
| 
|
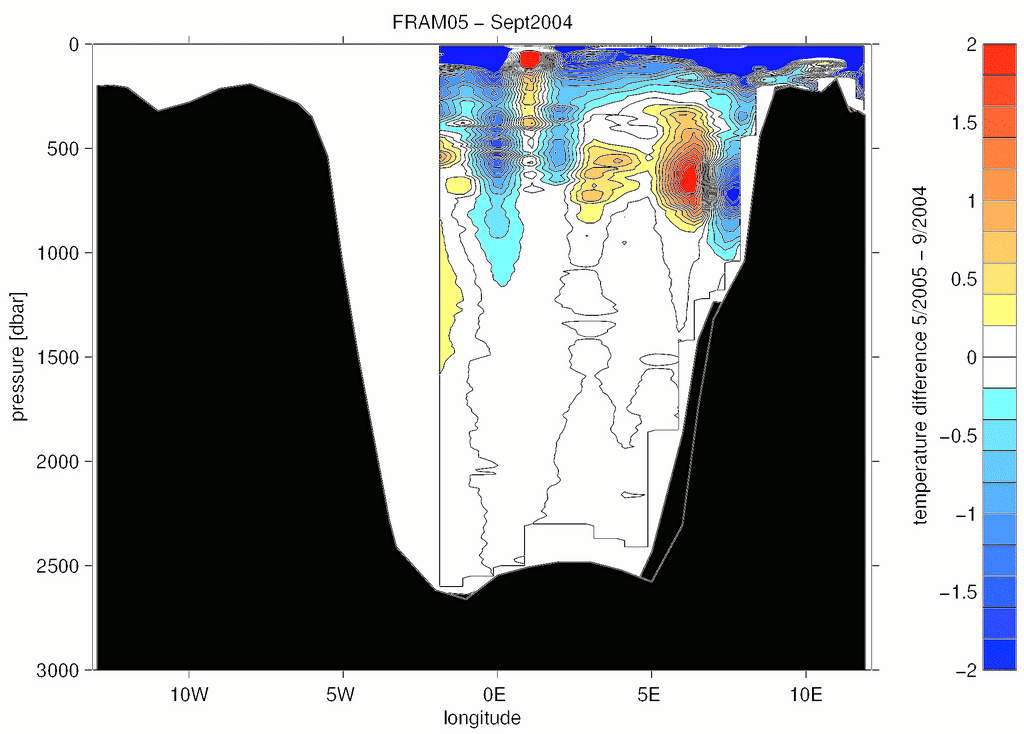
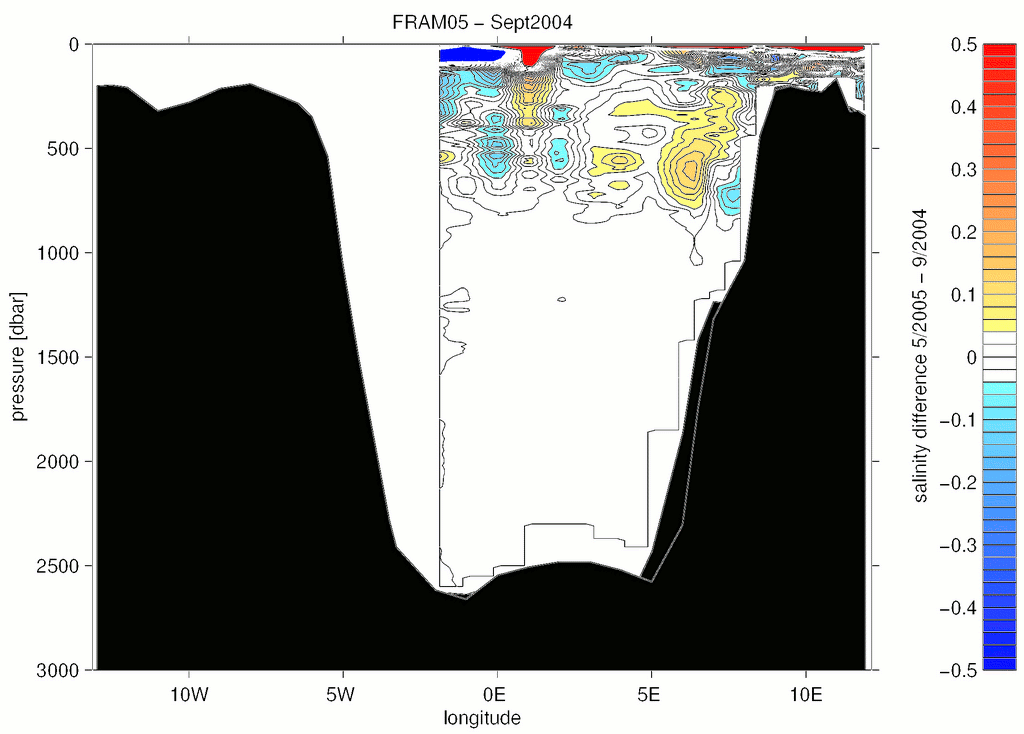
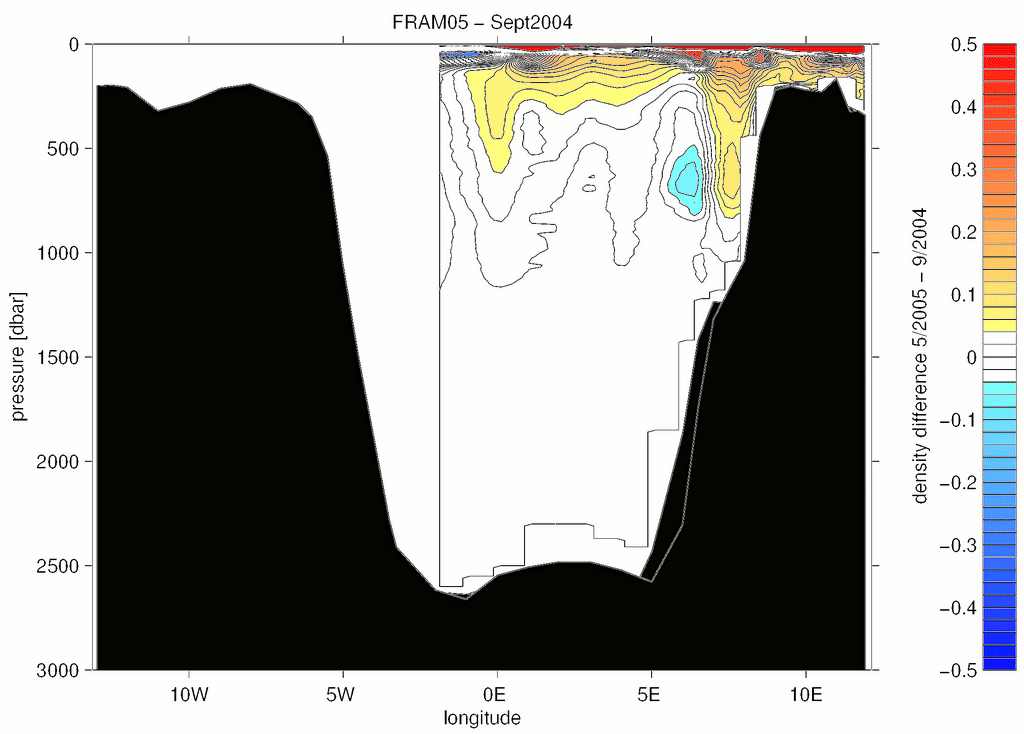
| Fig.24 Sections of the differences between May 05 and September 04 in temperature, salinity and density (from left to right). Red colours indicate higher values in May 05, blue values values that are lower in May 05 then in September 04. | ||
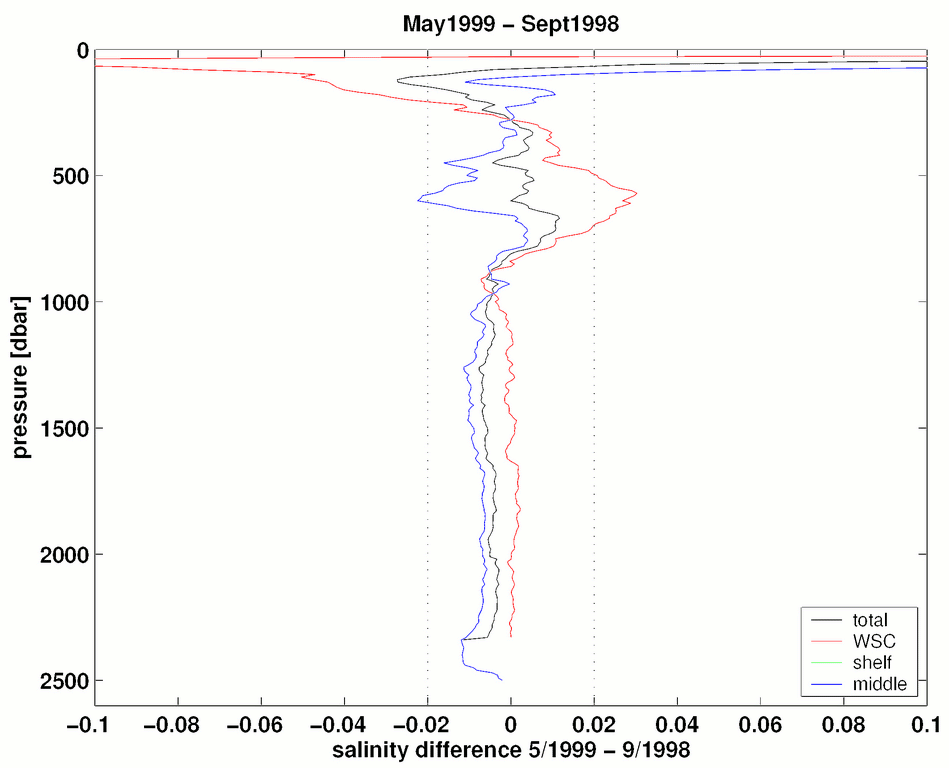
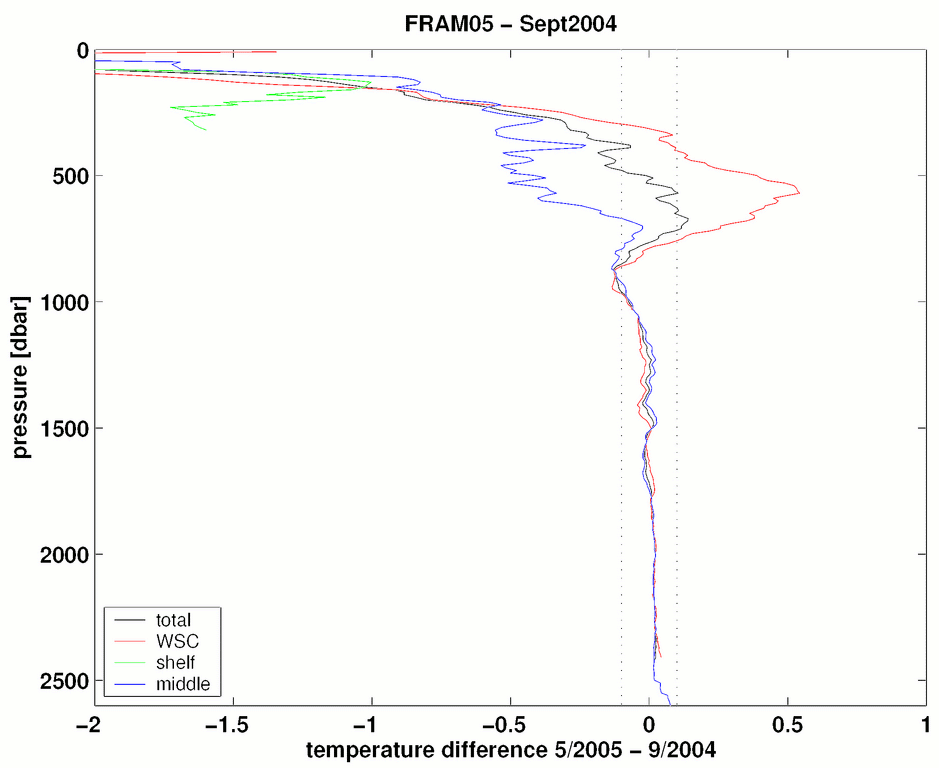
In all regions the uppermost water column (till about 50m) has higher salinities than in September (Fig.25). The middle of the Fram Strait has a pronounced decrease in salinity. This can be attributed to an eastward shift of the East Greenland front, which brings the cold and less saline Polar Water (PW) into regions up to 0ºW. As expected the surface waters are colder in May then in September, this cooling reaches depths of about 300 m in the West Spitsbergen region and 700m in the middle Fram Strait region (Fig.26). Associated with this cooling is an increase in density. The largest density increase is found at the surface due to the combined effect of cooling and higher salinities.
At mid-depths (400-800m) the warm AW is further east in May then in September, leading to colder waters in May at the continental slope and warmer waters further east. The mean temperature is higher in May east of 3ºW and colder west of 3ºW. The total change is small. The salinity signal corresponds to the temperature signal.
The deep waters (1800-2400m) are warmer (0.02) and less saline (-0.01) in May than in September.
The deepest waters near the bottom show negligible salinity changes, an increase in temperature in the West-Spitsbergen current region and none in the middle region.
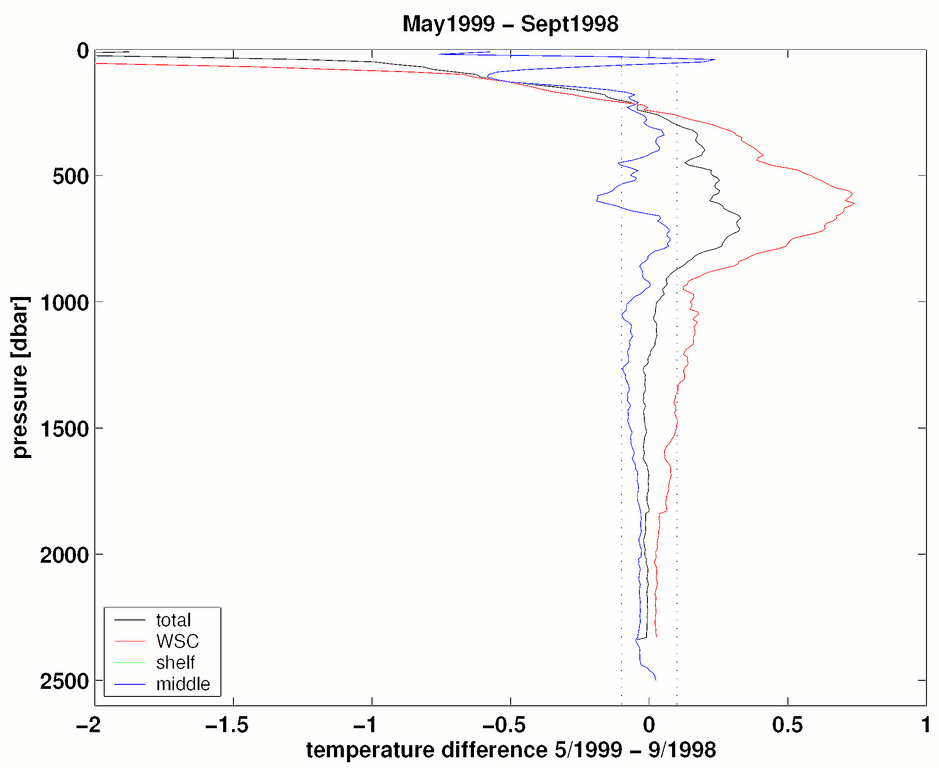
Many features of the 2005-2004 comparison can also be found in the 1999-1998 differences, and therefore are probably mostly signs of the seasonal cycle. The two strongest of these features are the colder and more saline upper waters and the warmer and more saline waters at mid-depths in the West-Spitsbergen current.
 |
 |
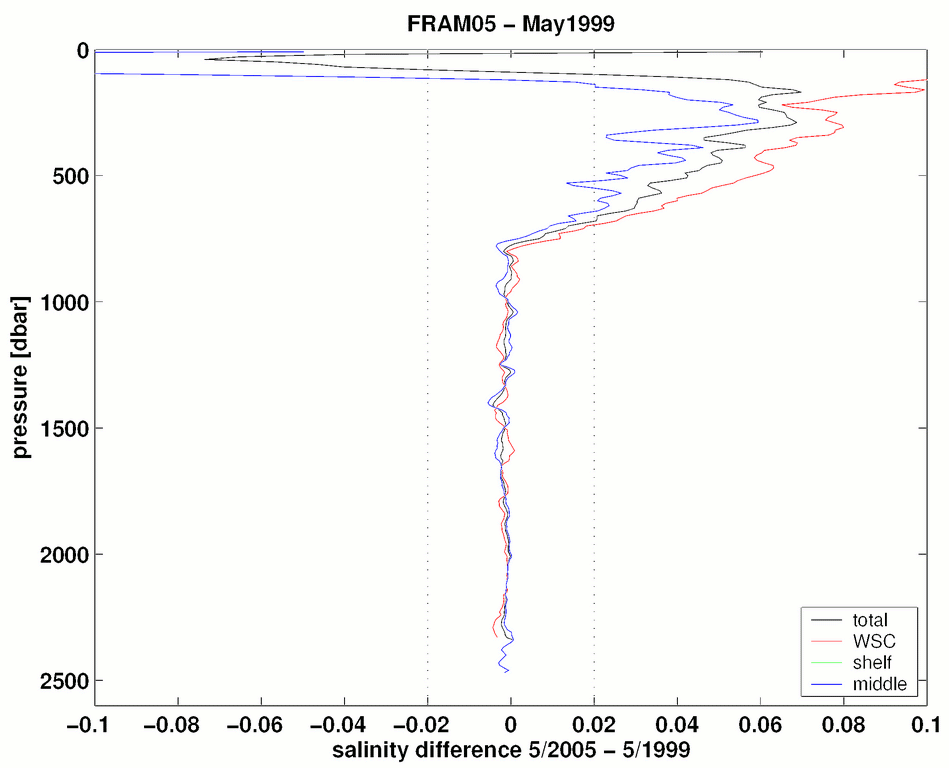 |
| Fig.25 Salinity differences in the 79ºN regions between May 05 and September 04 (left), May 99 and September 98 (middle) and between May 05 and May 99 (right). | ||
 |
 |
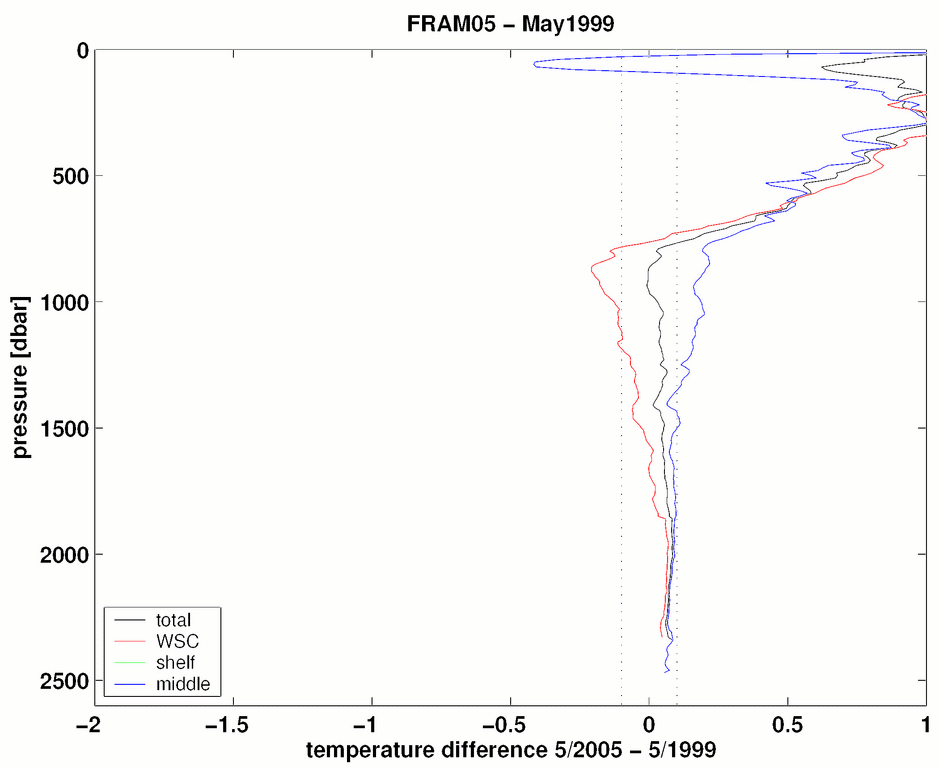 |
| Fig.26 Temperature differences in the 79ºN regions between May 05 and September 04 (left), May 99 and September 98 (middle) and between May 05 and May 99 (right). | ||
Comparing the May measurements from 2005 and 1999 we see a strong warming reaching more than 1ºC at depths of more then 500m. This warming is accompanied with a salinity increase. Comparing the maximum temperature in the core of the Atlantic Water with previous measurements in this area from May to June (Fig.27) the temperature is high (4.77ºC) in 2005. Just twice, in 1984 and 1990 higher temperatures (5.24ºC and 5.90ºC) were observed here in these months.
Fig. 27 Maximal temperature in the core of the West Spitsbergen
Current at latitude 79ºN in this cruise (red bar) and in previous
years (blue bars)
The ADCP recorded data throughout the cruise. The ADCP is a broadband 150kHz type and was set to 8m bins and an averaging interval of 300 seconds. The attained vertical range was about 200m. Just a first data check was made onboard. Along the 79ºN section (Fig.XX) two regions of larger northward velocity are apparent. The first at about 6ºW can be associated with the main core of the AW and the second region at about 8ºW is situated near the shelf break and the front between warm and saline AW and cold and fresh shelf water. The later is also visible at 78º 20'N at about 9ºW.
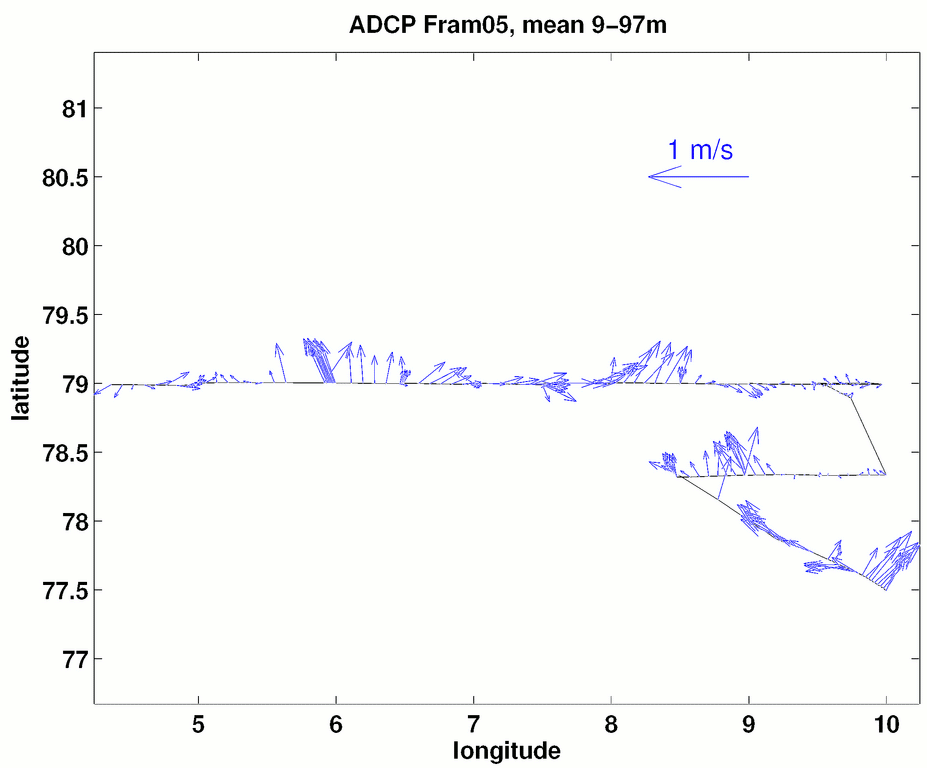
Fig. 28 Near surface velocities (9-97m) from the vessel mounted
ADCP.
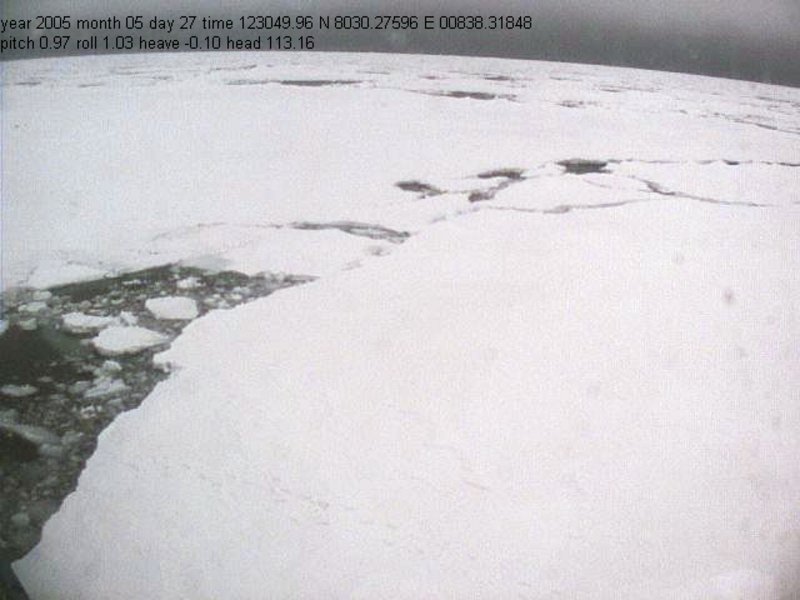
An IceCam is permanently installed onboard Lance and is set to record an image every 5 minutes via a web camera mounted on the bridge and looking to the starboard side. In addition GPS, time, pitch and roll are recorded. This data can later be analysed to give ice concentration.
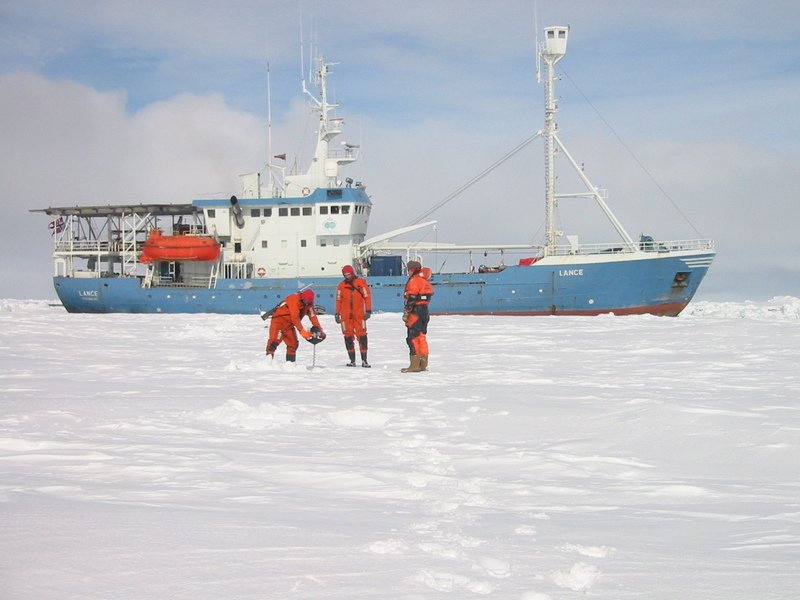
A total of 10 stations were taken, 6 full stations and 4 short stations. At each station the minimum work done was an ice thickness profile, and snow properties. For short stations the salinity and ice core temperature were dropped when time was limited.
The aim was to record the following data for each full station.
GPS position and time (start and end position of the ice floe to record ice drift)
Ice thickness
Snow thickness and physical properties
Ice cores â?" length, stratigraphy, temperature, photo
Air and water temperature
Salinity
Water samples
|
Station no. |
Date |
Latitude |
Longitude |
|
|
F05-L01 |
24.05.2005 |
78Ëš59.837â?™N |
01Ëš59.792â?™W |
Full |
|
F05-L02 |
24.05.2005 |
79Ëš32.007â?™N |
00Ëš27.54â?™E |
Short |
|
F05-L03 |
27.05.2005 |
80Ëš32.252â?™N |
08Ëš45.552â?™E |
Full |
|
F05-L04 |
27.05.2005 |
80Ëš37.494â?™N |
09Ëš47.050â?™E |
Full |
|
F05-L05 |
28.05.2005 |
80Ëš12.070â?™N |
05Ëš58.121â?™E |
Full |
|
F05-L06 |
29.05.2005 |
80Ëš01.649â?™N |
05Ëš29.709â?™E |
Short |
|
F05-L07 |
31.05.2005 |
78Ëš58.873â?™N |
00Ëš42.512â?™W |
Full |
|
F05-L08 |
31.05.2005 |
79Ëš04.478â?™N |
01Ëš24.068â?™W |
Full |
|
F05-L09 |
01.06.2005 |
78Ëš58.384â?™N |
01Ëš57.935â?™W |
Medium |
|
F05-L10 |
01.06.2005 |
78Ëš57.432â?™N |
02Ëš05.997â?™W |
Medium |
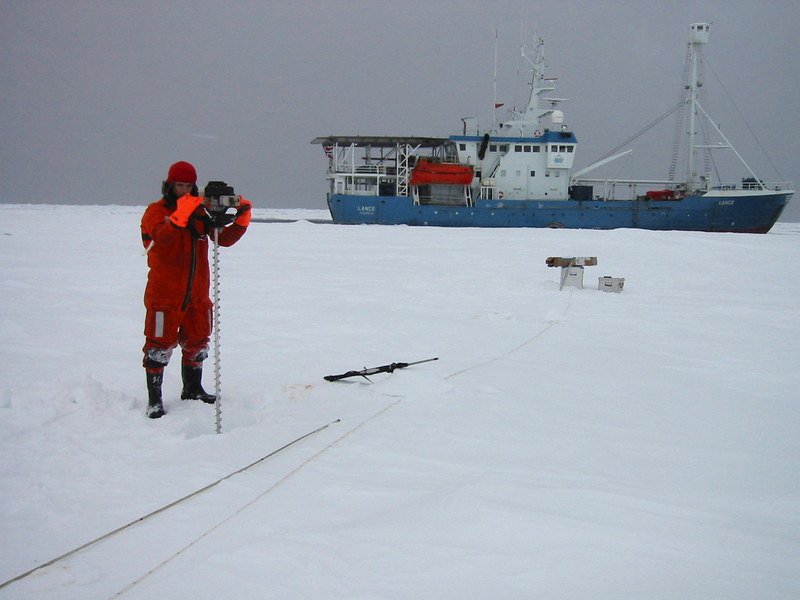
Floes were chosen as large as possible and were accessed either directly from Lance or by Zodiac. Thickness profiles 50-100m in length were measured with profiling every 10m. We used a Covacs thickness drill. Together with ice thickness we also recorded snow cover thickness and freeboard.
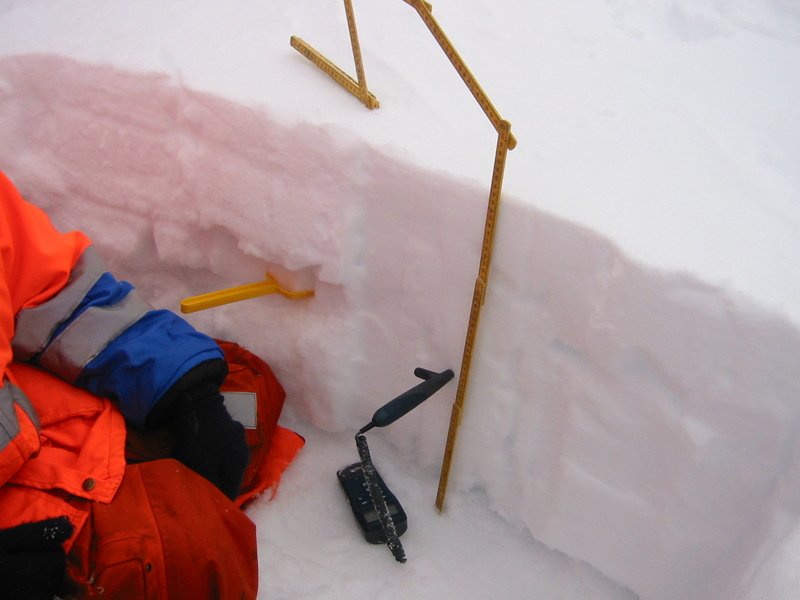
Physical snow properties were recorded at every station. The site chosen for the snow pit was selected as representative for the floe.
The following parameters were recorded
Snow description:
Snow type
Avg, min, max grain diameter
Hardness test
Draw / photograph stratigraphy profile
Snow temperature every 2-5cm (depending on snow pack thickness and layering)
Snow density â?" no. of samples depending on the snow thickness
Salinity measurements every 10cm in the snow pack at stations where ice core salinity is measured
Water temperature was taken from the side of the floe if possible. Sometimes the ice station corresponded with a CTD station and therefore both temperature and salinity measurements can be obtained from this data
Air temperature was recorded at 1m above the surface in the body shadow
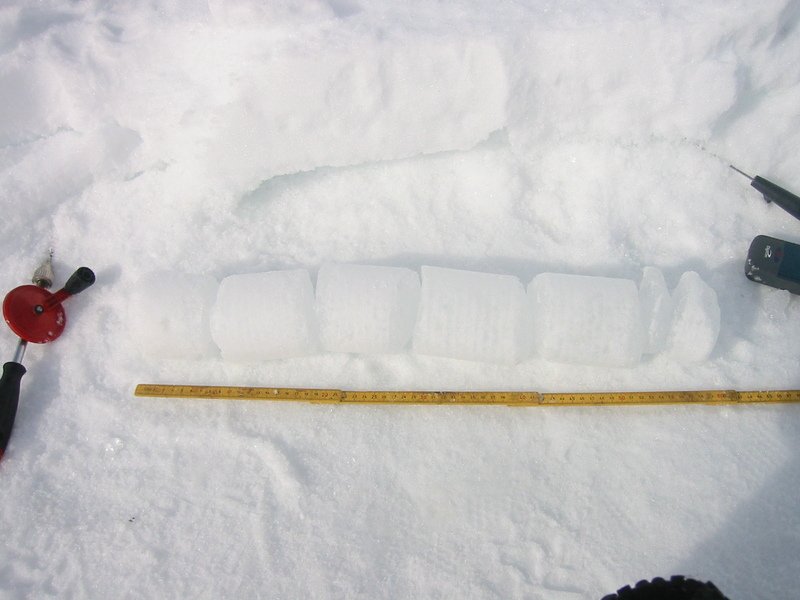
8 ice cores were drilled at stations 1, 3, 4, 5, 7, 8, 9, and 10 in level ice of average thickness. The core was photographed and the total length recorded. The temperature approximately every 10cm was measured by drilling a hole with a hand drill in the core and inserting the temperature probe. This was done quickly section for section to avoid temp changes. The stratigraphy of the core was noted and peculiarities marked such as sediment or algae were recorded
To measure salinity along sections of the ice core we cut the core into ca. 7-10cm sections and then bagged and labelled each section. Onboard Lance the samples were melted and bottled so that salinity could be measured in Tromsø. No salinity samples were taken for cores 9 and 10.
Traces of green algae were found in core 7.
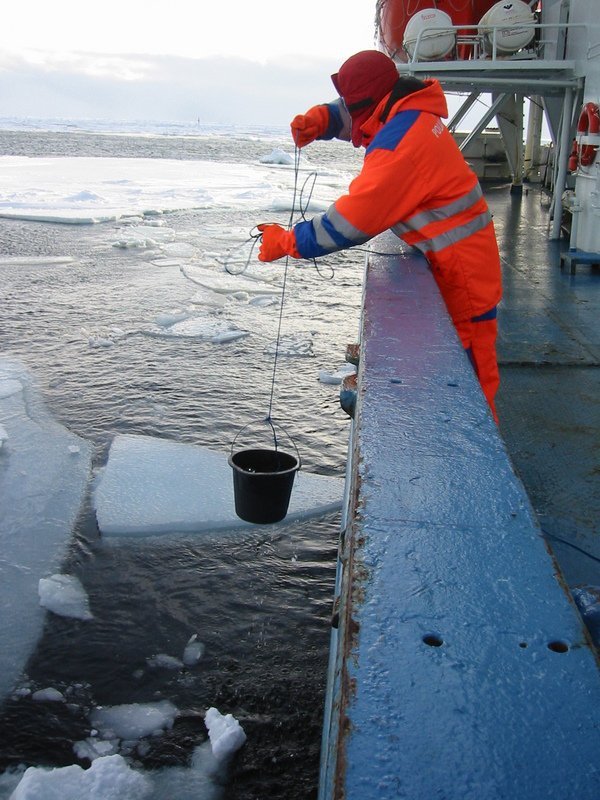
2 x 50 liter samples were taken with a bucket from the side of the ship for analysis in Tromsø for traces of radionuclides.
West Spitsbergen current off Kongsfjorden N79deg 00â?™, E08deg 30â?™
Date: 22.05.2005
Time: 20:30
N80deg 16.9â?™, E06deg 18â?™
Date: 27.05.2005
Time: 00:45
Sea ice 1st year, 10m floes, 0.5m thick, 20cm snow cover
Long before the beginning of precise instrumental observations, simple optical observations of seawater visibility depth through a white so-called Sekki disk (see picture below) were used.
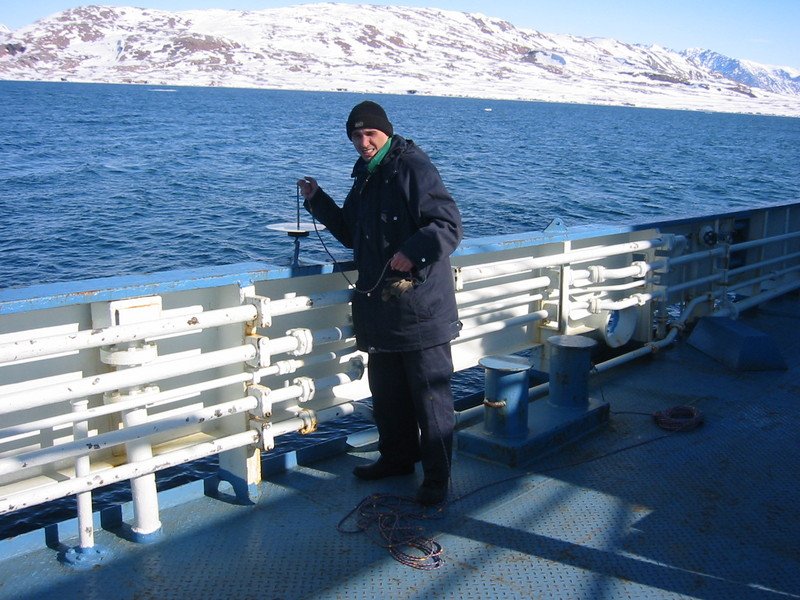 Sekki disc view
The transparency characterises properties of the physical environment to loosen electromagnetic radiation in the optical range. The spatial and temporal allocation of optical properties of seawater is defined by the allocation of a dissolved organic material and suspended sediments concentration. In the open sea these are defined by the concentration of organic and non-organic material, water dynamics and turbulence. The last two factors are responsible for the transport and distribution of this material. Shore and shelf erosion, along with river discharge provide the major contribution to the optical properties of seawater.
During the Lance cruise 40 relative seawater transparencies were taken. Station positions and transparency value are listed in the Table 2 and shown in Fig 29.
Table 2 Station positions and value of the relative seawater transparency
|
â"- |
Date |
Time (GMT) |
Longitude |
Latitude |
Depth, m |
|
1 |
20.05.2005 |
11:15 |
12,5968 E |
76,3000 N |
16 |
|
2 |
20.05.2005 |
13:50 |
14,0050 E |
76,3007 N |
12 |
|
3 |
20.05.2005 |
15:15 |
14,2982 E |
76,2994 N |
11,5 |
|
4 |
20.05.2005 |
16:35 |
14,5499 E |
76,2994 N |
6,5 |
|
5 |
20.05.2005 |
18:10 |
15,2980 E |
76,3000 N |
6,5 |
|
6 |
22.05.2005 |
06:40 |
10,0030 E |
79,0000 N |
8 |
|
7 |
22.05.2005 |
07:30 |
10,3000 E |
79,0000 N |
7,5 |
|
8 |
22.05.2005 |
08:30 |
11,0000 E |
79,0000 N |
10,5 |
|
9 |
22.05.2005 |
09:40 |
11,4196 E |
78,5890 N |
7,5 |
|
10 |
22.05.2005 |
10:20 |
11,5630 E |
78,5760 N |
7,5 |
|
11 |
24.05.2005 |
08:45 |
01,5830 E |
78,5990 N |
12 |
|
12 |
24.05.2005 |
23:45 |
00,2534 E |
79,3168 N |
7 |
|
13 |
25.05.2005 |
08:35 |
02,0000 E |
79,3000 N |
12,5 |
|
14 |
25.05.2005 |
11:20 |
03,0001 E |
79,2995 N |
11 |
|
15 |
27.05.2005 |
09:00 |
08,4611 E |
80,3245 N |
5,5 |
|
16 |
27.05.2005 |
14:40 |
09,4670 E |
80,3590 N |
6 |
|
17 |
27.05.2005 |
16:50 |
09,4857 E |
80,3758 N |
5,5 |
|
18 |
27.05.2005 |
21:30 |
10,2200 E |
80,2960 N |
6,5 |
|
19 |
27.05.2005 |
23:10 |
11,0230 E |
80,2225 N |
7 |
|
20 |
28.05.2005 |
00:30 |
11,4310 E |
80,1480 N |
6,5 |
|
21 |
28.05.2005 |
01:40 |
12,2250 E |
80,0740 N |
7 |
|
22 |
28.05.2005 |
02:50 |
13,0030 E |
80,0004 N |
7,5 |
|
23 |
28.05.2005 |
06:30 |
10,2020 E |
79,4500 N |
9 |
|
24 |
28.05.2005 |
07:45 |
09,3460 E |
79,5100 N |
9 |
|
25 |
28.05.2005 |
09:15 |
08,5020 E |
79,5690 N |
7 |
|
26 |
28.05.2005 |
10:40 |
08,0680 E |
80,0360 N |
7 |
|
27 |
28.05.2005 |
12:15 |
07,2070 E |
80,0960 N |
6,5 |
|
28 |
28.05.2005 |
17:15 |
05,5850 E |
80,1210 N |
8 |
|
29 |
29.05.2005 |
03:55 |
04,5920 E |
79,5240 N |
8 |
|
30 |
29.05.2005 |
06:20 |
04,2970 E |
79,4200 N |
7,5 |
|
31 |
29.05.2005 |
19:30 |
06,0010 E |
79,3020 N |
7,5 |
|
32 |
29.05.2005 |
21:10 |
06,3030 E |
79,3000 N |
7 |
|
33 |
29.05.2005 |
22:35 |
07,0030 E |
79,3000 N |
7 |
|
34 |
29.05.2005 |
23:55 |
07,3040 E |
79,3005 N |
7 |
|
35 |
30.05.2005 |
01:10 |
07,5950 E |
79,3000 N |
6,5 |
|
36 |
30.05.2005 |
03:55 |
09,3010 E |
79,3000 N |
10 |
|
37 |
30.05.2005 |
04:45 |
10,0010 E |
79,3000 N |
11,5 |
|
38 |
30.05.2005 |
08:05 |
11,2580 E |
79,0120 N |
9 |
|
39 |
31.05.2005 |
9:50 |
0,4400 W |
78,5900 N |
7,5 |
|
40 |
31.05.2005 |
11:20 |
1,2291 W |
79,0460 N |
7 |
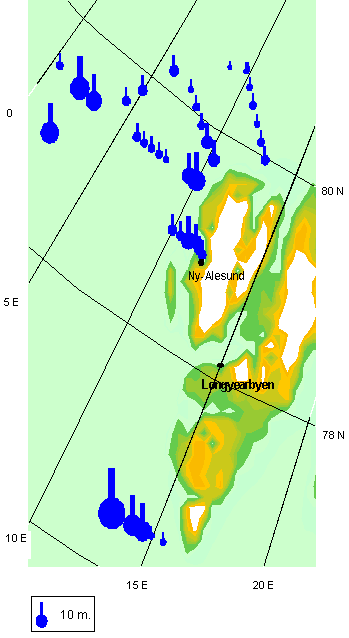
Fig. 29 Relative seawater transparency distribution.
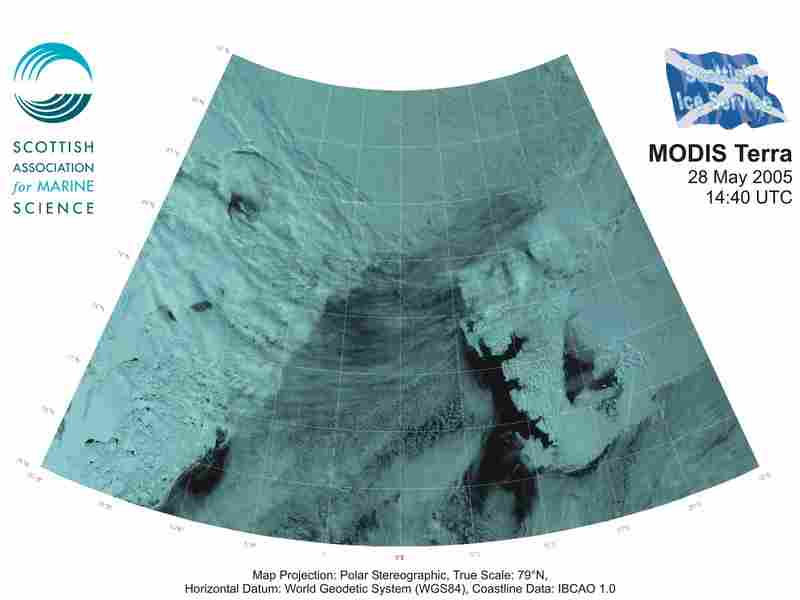
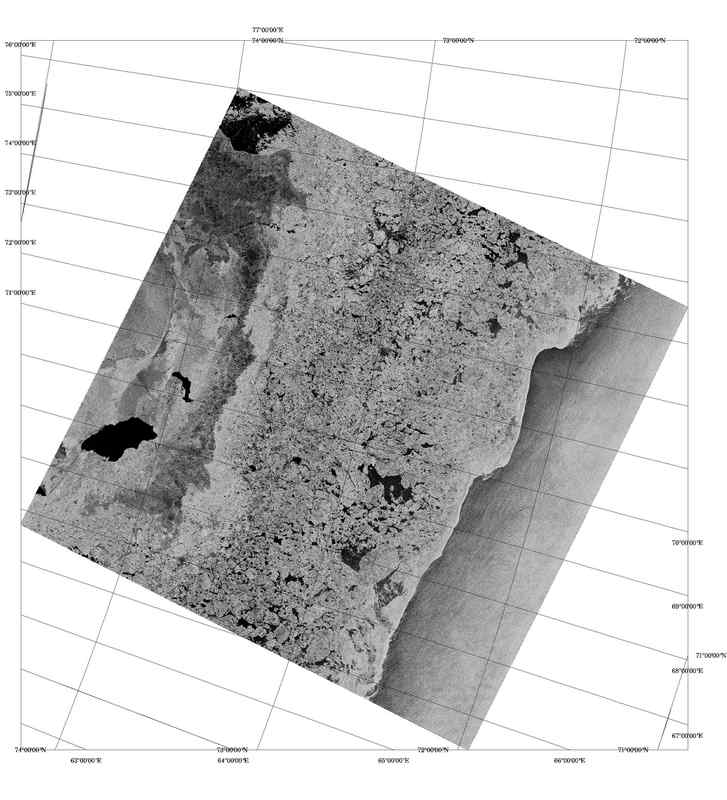
Processed MODIS satellite images were received daily from Nick Hughs from SAMS and were a useful tool for the daily operation of the cruise. Met.no provided daily ice charts useful for anticipating encounters with the sea ice edge and for planning ice stations. In addition we received Radarsat and Envisat high resolution SAR imagery for the area of operation. These were not available daily for the particular area Lance was operating in but were extremely useful for assessing ice conditions when entering the marginal ice zone. The SAR imagery was processed by Mohamed Keyse at NP
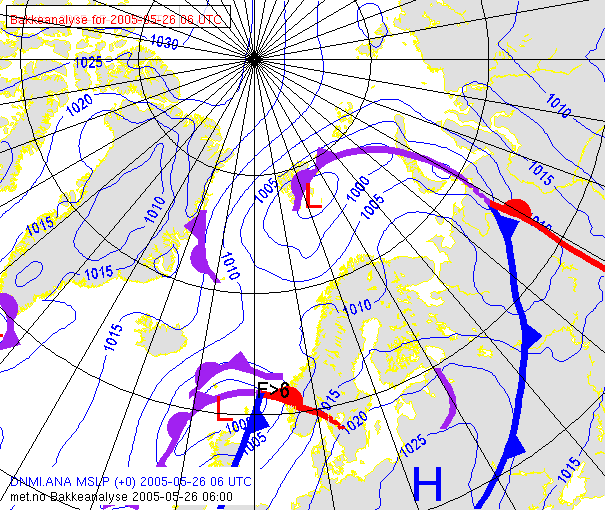
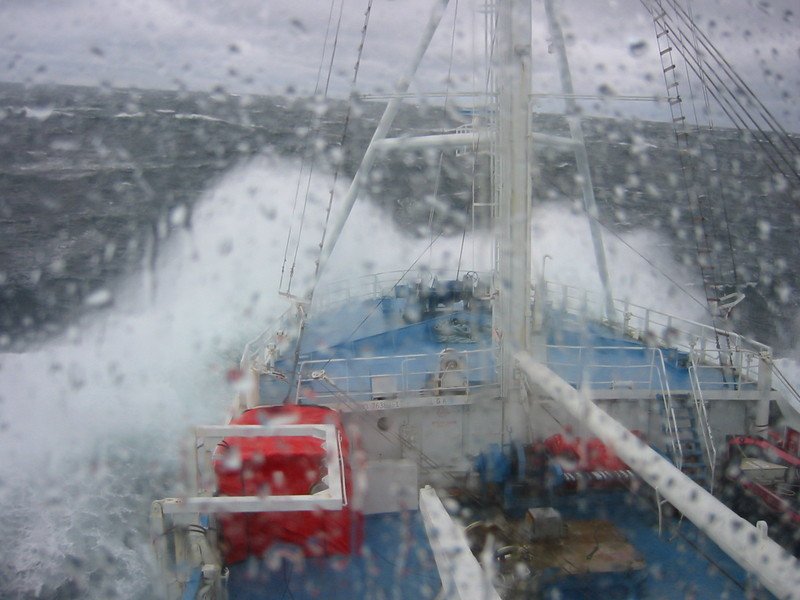
An automatic weather station is installed on Lance and logs data continuously. The system records air temperature, sea water temperature, humidity, wind speed and direction, and air pressure. During a period of bad weather we received synoptic weather forecast charts from met.no which helped in planning the next phase of the cruise. These charts would have been beneficial on a daily basis and should be acquired on future cruises.
|
|
|
We are very grateful for the excellent support and the splendid seamanship of the captain, officers and crew of Lance. Their professional conduct and willingness to help made this cruise extremely successful. In fact without their help we could not have accomplished our mission.